
A data-driven look at how feedstocks, region, and process integration shape SAF carbon intensity and project economics
How feedstock origin and process design shape emissions under CORSIA
The Carbon Offsetting and Reduction Scheme for International Aviation (CORSIA) defines how airlines measure and report life-cycle emissions from Sustainable Aviation Fuel (SAF). Its standardized default values simplify compliance and enable global comparison but they also flatten real variability across pathways, obscuring how sourcing decisions and process design actually influence carbon intensity.
In practice, those variations are substantial:
• A HEFA facility using palm oil can emit anywhere from 35 to 95 gCO₂e/MJ depending solely on where the feedstock is grown, a spread wider than the difference between entire technology classes.
• An alcohol-to-jet (ATJ) facility can lower emissions by more than 15 gCO₂e/MJ simply by recovering waste heat rather than purchasing natural gas.
These differences determine whether a project qualifies under CORSIA, gains access to policy credits, and remains economically viable.
To make these dynamics visible, Sesame’s Pathway Navigator applies the CORSIA framework dynamically. Instead of static LCA values, users can explore how feedstock origin, land-use assumptions, and process integration interact to shape both carbon and cost outcomes.
Previous Sesame Insights have examined the economics and decarbonization potential of Sustainable Aviation Fuels (SAF) across different feedstocks and conversion routes. This Insight Article highlights why SAF pathways differ and how modeling tools that expose those parameters help developers, airlines, and policymakers make better decisions.
1. Feedstock and Regional Effects
The Sesame Navigator allows direct comparison between pathways modeled with and without land-use change (LUC) factors, revealing how regional assumptions reshape life-cycle outcomes under CORSIA framework.
Without land-use penalties, HEFA fuels produced from palm, soybean, or rapeseed oil typically fall well below the conventional jet fuel baseline of 89 gCO₂e/MJ, which captures the full fuel supply chain (from crude extraction and transport through refining, distribution, and combustion). Under CORSIA rules, a fuel must achieve at least a 10% reduction relative to this baseline to qualify as a CORSIA Eligible Fuel (CEF).¹ In Figure 1, pathways that fall below the horizontal reference line meet this criterion.
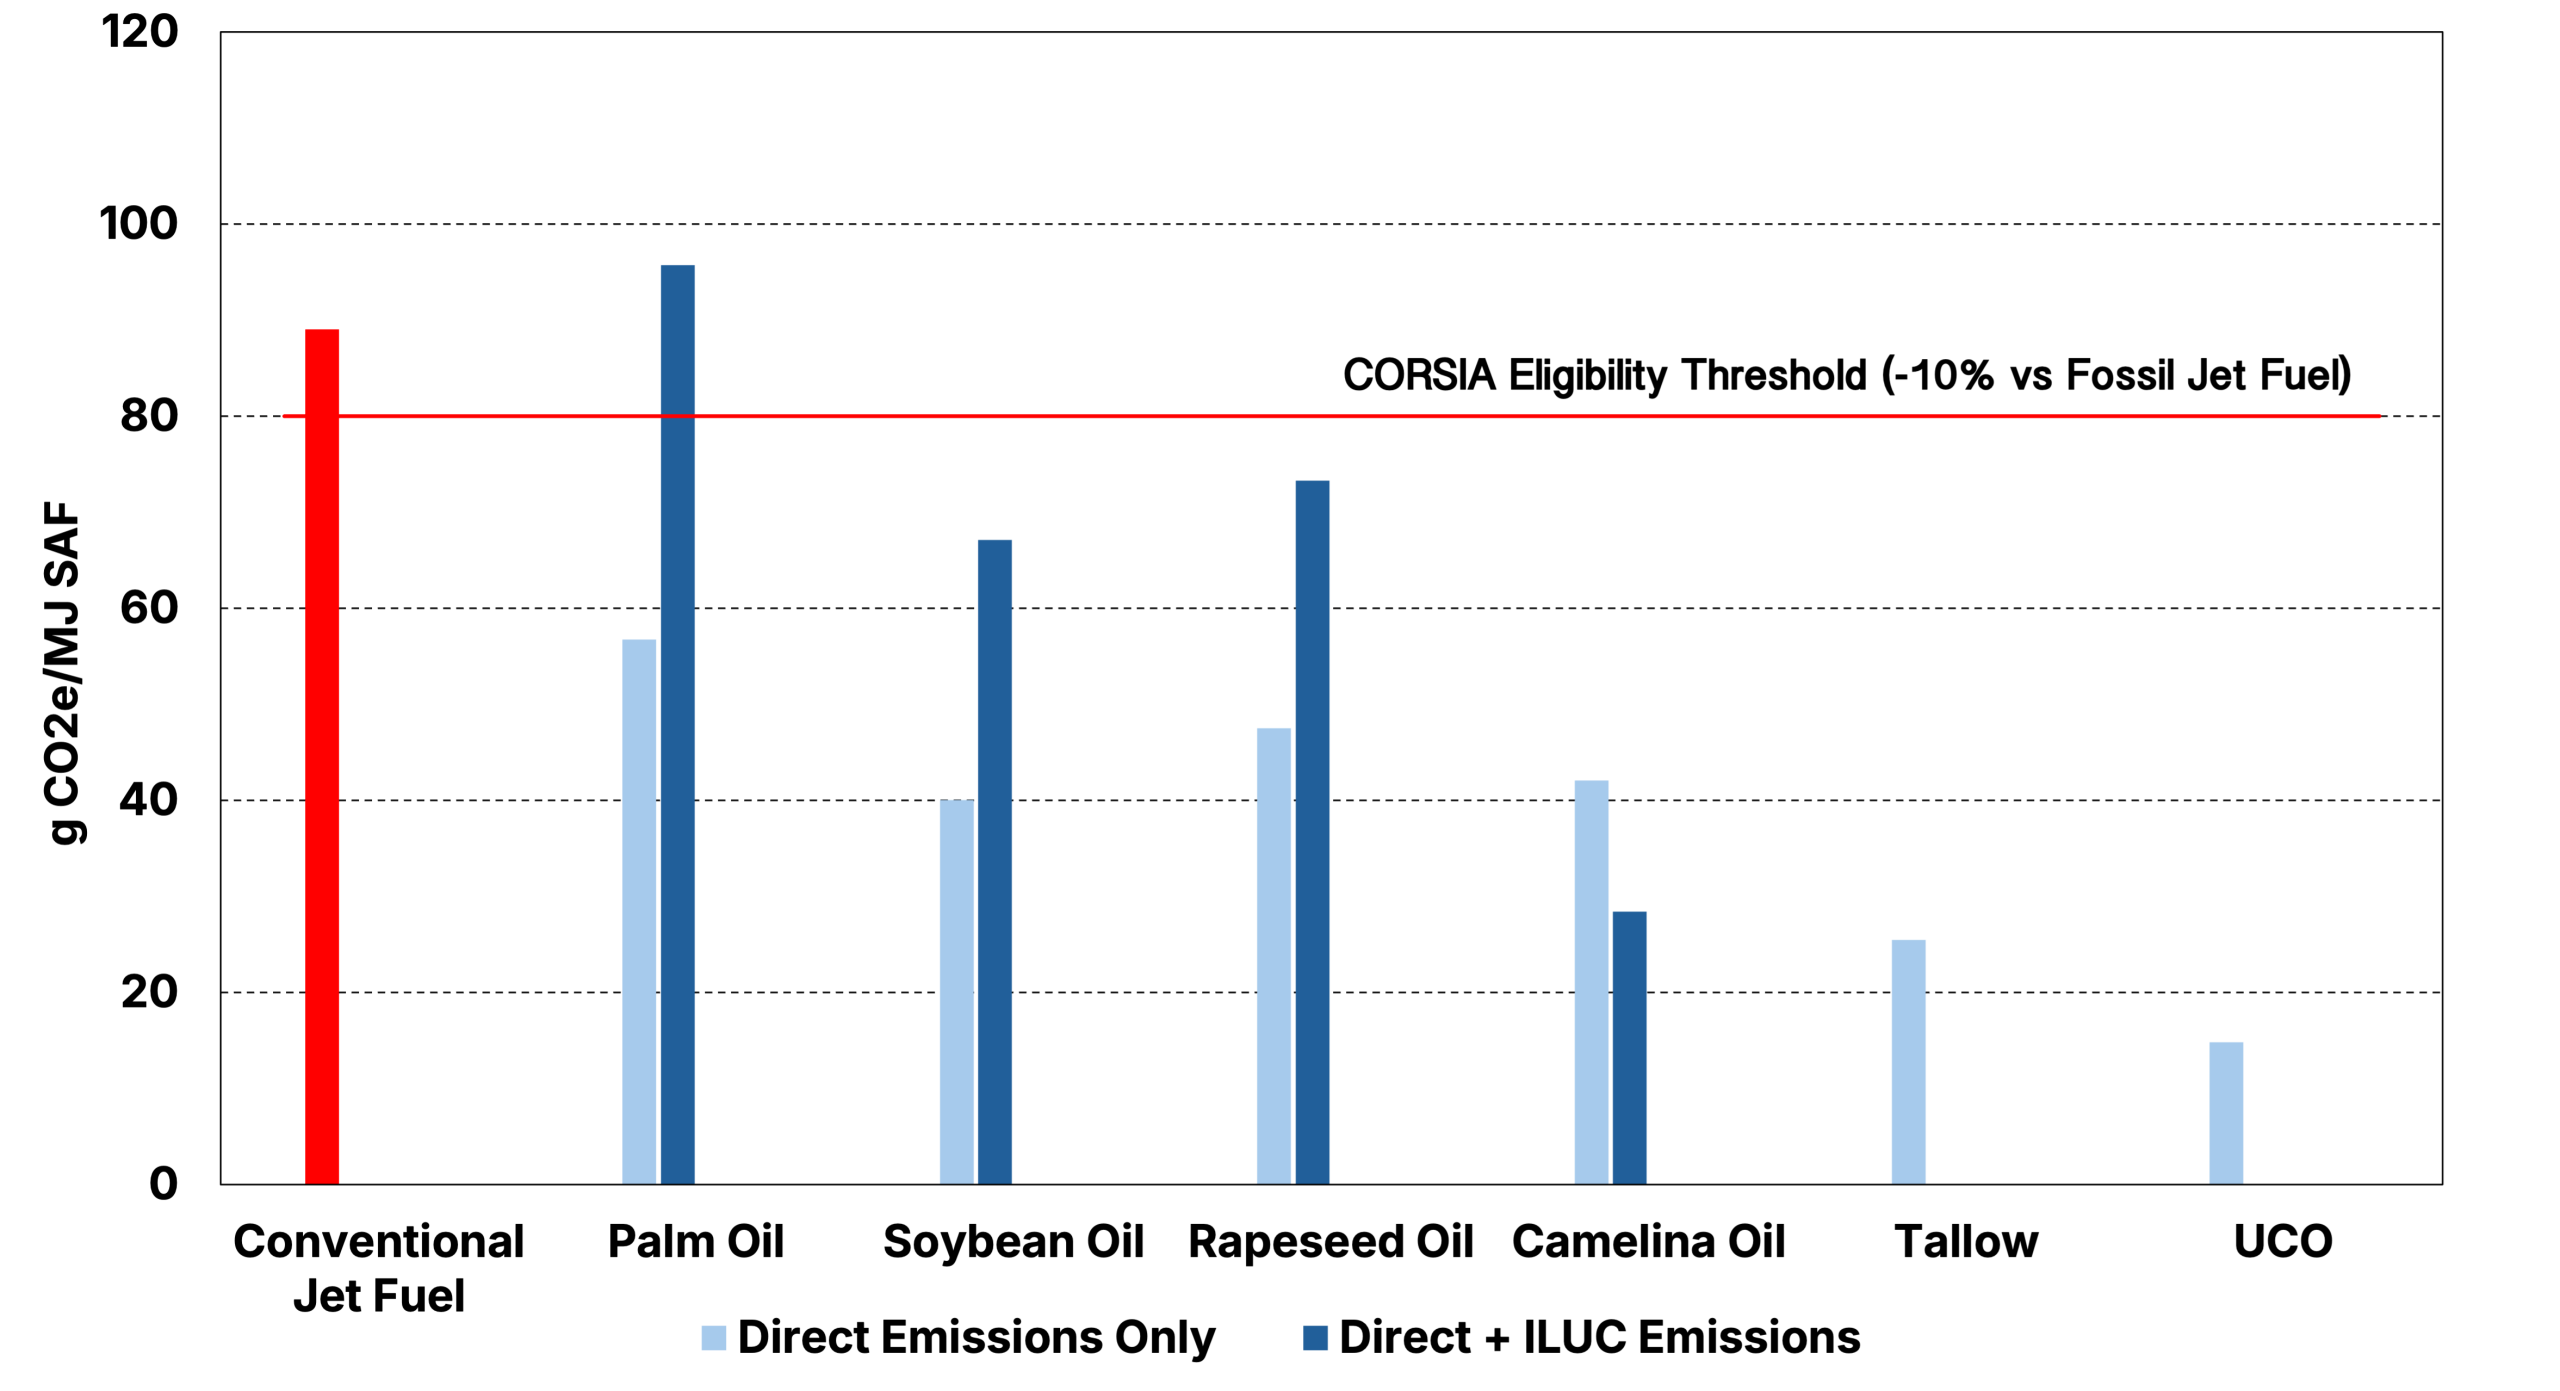
Figure 1. Life-cycle carbon intensity of HEFA pathways with and without indirect land-use change (ILUC) factors. Light blue bars show values excluding ILUC, while dark blue bars show values after applying ILUC penalties for different regions. The horizontal red line marks the CORSIA eligibility threshold (80 gCO₂e/MJ); pathways falling below this line qualify as CORSIA Eligible Fuels (CEF).
But when regional LUC factors are applied, the picture changes dramatically:
• Palm oil sourced from Southeast Asia can rise above the fossil baseline.
• Soybean and rapeseed increase but typically remain below the threshold.
• Waste-derived feedstocks like UCO(Used Cooking Oil) and tallow are not subject to ILUC penalties. As a result, they consistently form the lower bound of emissions performance.
This means the same HEFA technology can qualify in one geography and fail in another without changing anything about the process itself.
By revealing this sensitivity, the Sesame Navigator shows how site selection and sourcing strategy can be as decisive as process design in determining a project’s carbon eligibility. But regional variation is only half the picture, and economic feasibility defines which pathways actually scale.
2. Costs and Carbon Intensity
CORSIA standardizes emissions accounting, but it offers no way to evaluate cost-effectiveness. Yet commercial viability depends on both.
Conventional jet fuel averages $0.55/L, while SAF spans $0.60–1.20/L depending on feedstock costs, hydrogen sourcing, and regional energy prices.
Waste- and residue-based HEFA fuels, such as UCO and tallow, occupy the lower end of the carbon spectrum, often cutting emissions by more than two-thirds relative to fossil jet fuel. UCO-based HEFA, for instance, achieves roughly an 80% carbon intensity reduction at $0.65 /L, representing a drastic emission reduction for only a 20% cost premium.
Plotting cost premium against percent carbon intensity reduction exposes the real trade-offs: some low-carbon options are expensive, while others deliver outsized climate benefit at modest price increases.

Figure 2. Percent carbon intensity reduction versus cost premium of SAF pathways under the CORSIA framework. Each point represents a modeled pathway, colored by feedstock type and shaped by conversion technology. The horizontal axis shows additional cost relative to fossil jet fuel ($/L); the vertical axis shows percent carbon intensity reduction relative to the CORSIA baseline.
This integrated cost-emissions view helps airlines make procurement decisions, helps policymakers target incentives, and helps producers identify where process improvements pay off most.
3. Process Integration Sensitivity
Beyond feedstock and regional factors, process configuration itself drives major variation within a single technology. In standalone ATJ systems, hydrogen, electricity, and process heat are purchased externally, each carrying embedded emissions from grid power or natural gas combustion. Integrated designs, by contrast, recover these utilities internally – capturing hydrogen from off-gases, generating steam from reaction heat, or using biomass residues for thermal energy. This approach reduces indirect emissions without requiring major capital investments beyond heat exchangers and separation equipment.
The same design choices also improve economics. Standalone ATJ facilities average 1.11 $/L, while integrated systems fall to 0.95 $/L, reflecting savings from reduced hydrogen purchases and lower utility demand. The roughly 0.16 $/L difference captures the avoided cost of external energy inputs and the efficiency gains from thermal recovery, demonstrating that integration enhances both environmental and financial performance.
Comparing standalone and integrated ATJ pathways shows that internal recovery of heat and hydrogen can cut emissions by over 15 gCO₂e/MJ under identical CORSIA boundaries, often with neutral or even favorable impacts on operating costs due to lower utility demand.
Interactive modeling makes this variability visible: adjusting heat source, electricity origin, or hydrogen supply isolates the effect of each design choice.
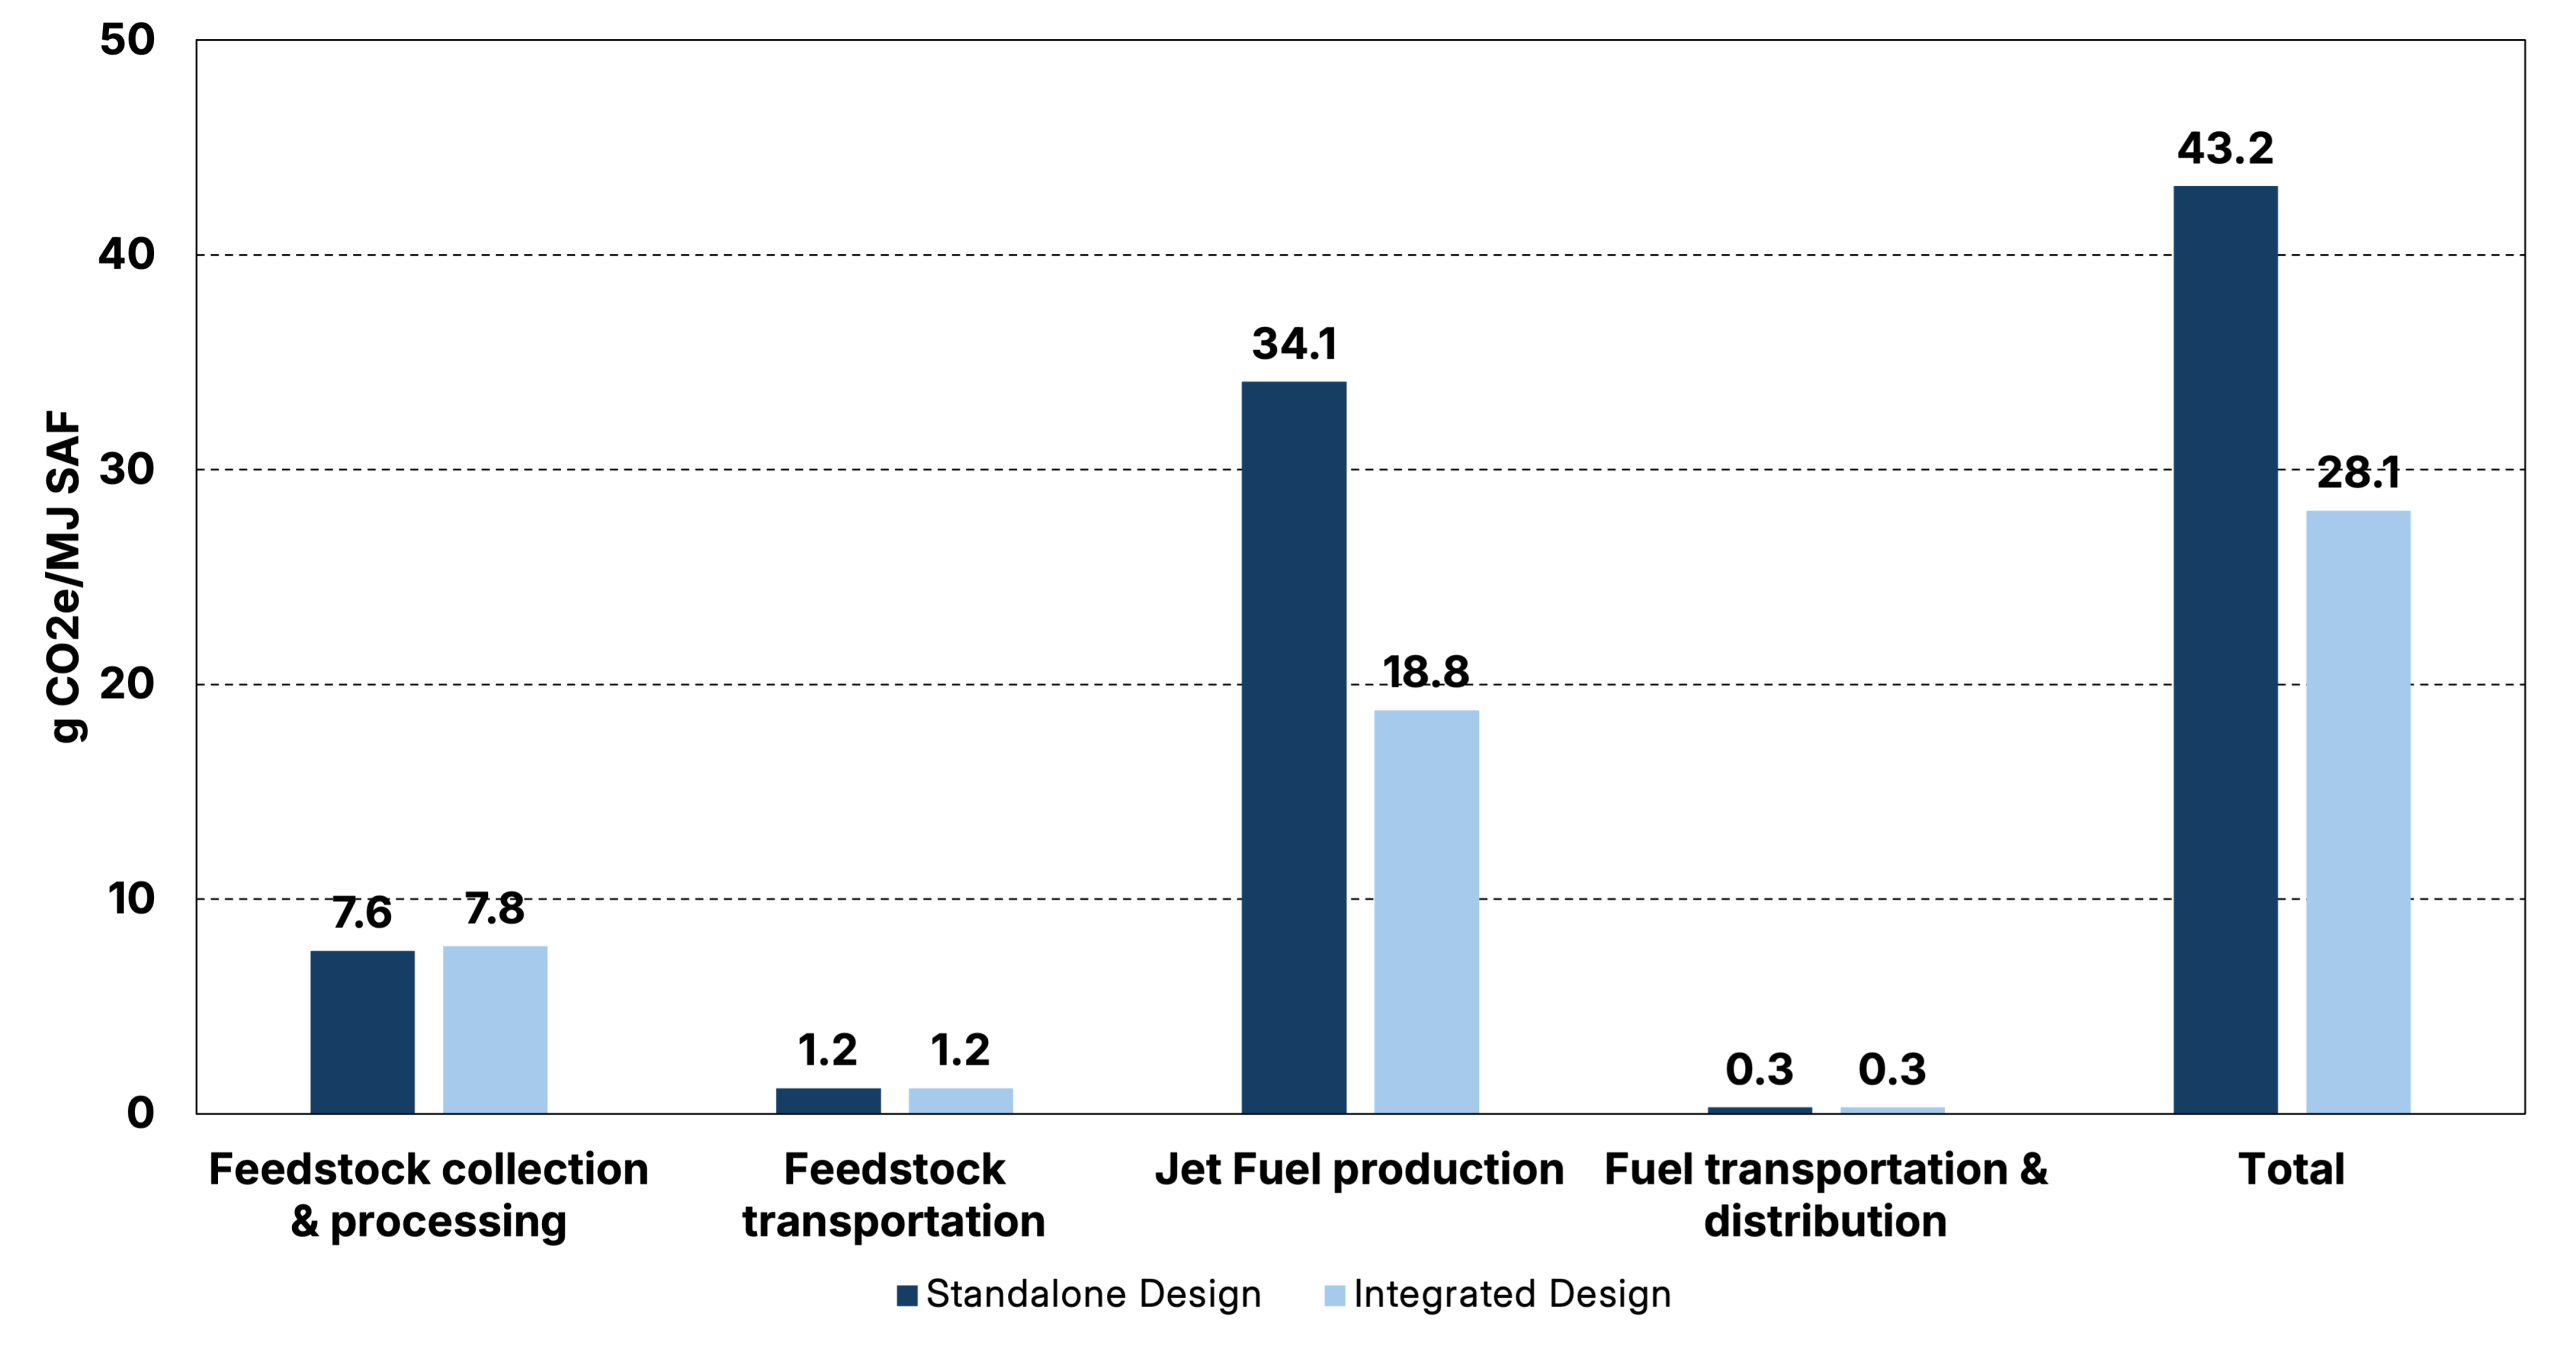
Figure 3. Life-cycle emissions breakdown for standalone and integrated ATJ pathways from cellulosic feedstocks.
This level of configurational transparency is typically hidden in summarized LCA results. Here, users can isolate the impact of each assumption and design choice, enabling informed trade-off analysis early in project development.
Conclusion
SAF carbon intensity and economic performance are shaped by three interacting factors:
• Feedstock origin
• Regional land-use
• Process design and integration choices
Static averages obscure these dynamics. Sesame makes them explicit. By modeling pathways dynamically under CORSIA, Sesame’s Pathway Navigator shows not only how much a pathway emits, but why and what levers can move a project into cost-effective, CORSIA-eligible territory.
For developers, investors, airlines, and policymakers, this provides a new level of clarity for crediting, site selection, procurement, and capital planning, accelerating deployment of SAF pathways that deliver both climate benefit and economic viability.
This transition is already underway. LanzaJet’s Freedom Pines Fuels facility (the first commercial ATJ plant) demonstrates how rapidly SAF production is scaling and how significant feedstock choice, regional sourcing, and process configuration becomes as real projects move into operation. As more facilities progress from concept to commercialisation, transparent modeling that reveals these underlying drivers will play a critical role in crediting, procurement, and financing decisions.
1. CORSIA’s 10% reduction threshold and baseline methodology are defined in the ICAO CORSIA Supporting Document on Life Cycle Assessment Methodology.https://www.icao.int/sites/default/files/environmental-protection/CORSIA/Documents/CORSIA%20Eligible%20Fuels/ICAO-document-06-Default-Life-Cycle-Emissions-June-2025.pdf
2. Conventional Jet Fuel Prices, 2025. https://www.iata.org/en/iata-repository/publications/economic-reports/global-outlook-for-air-transport-june-2025/
3. https://www.lanzajet.com/news-insights/lanzajet-makes-history?utm_medium=email&utm_source=govdelivery