
Sustainable Aviation Fuel (SAF) is gaining momentum as a key tool in decarbonizing the aviation sector—but not all SAF is created equal. In this insight, we compare three of the most widely used U.S.-approved SAF technologies: Fischer-Tropsch (FT), Hydroprocessed Esters and Fatty Acids (HEFA), and Alcohol-to-Jet (AtJ). Using Sesame Sustainability’s modeling platform, we evaluate their emissions profiles, production costs, and policy incentives. The results reveal how technology choice, feedstock, and carbon capture strategies can make or break SAF’s environmental and economic viability in today’s evolving policy landscape.

In 2023, IEA concluded that 2.5% of the world’s carbon emissions were from the aviation industry. That contribution is growing, and outpacing most other transportation types. A recent focus to combatting these emissions is the use of Sustainable Aviation Fuels, also referred to as SAF. SAFs are derived from biological carbon sources, repurposing carbon that is already circulating in the natural carbon cycle — rather than adding new fossil-based carbon to the atmosphere. This “biogenic carbon” is the key to SAF’s emission reduction when compared to traditional fuels.
SAF is far from a one size fits all solution. There are hundreds of combinations: between feedstock choice and farming location, the process used to produce SAF, location of the plant, etc. In this insight, we’re going to take a look at three of the most popular SAF technologies from the perspective of the United States SAF portfolio.
Existing SAF technologies
ASTM recognizes 8 separate SAF production methods. ASTM D7566 is the global standard that defines the specification for synthetic aviation turbine fuels. Of these 8, three technologies are ASTM approved:
• Hydroprocessed Esters and Fatty Acids (HEFA)
• Fuel synthesized via Fischer-Tropsch (FT)
• Alcohol to Jet (AtJ)
| ASTM Designation | Process Description | Symbol | Feedstock | Max Blend Percentage | Technology Readiness Level |
| ASTM D7566 Annex A1 | Fischer-Tropsch hydroprocessed synthesized paraffinic kerosene | FT | Biomass | 50% | 7 |
| ASTM D7566 Annex A2 | Synthesized paraffinic kerosene from hydroprocessed esters and fatty acids | HEFA | Vegetable oils, animal fats, used cooking oils | 50% | 9 |
| ASTM D7566 Annex A4 | Synthesized kerosene with aromatics derived by alkylation of light aromatics from non-petroleum sources | FT-SKA | Biomass | 50% | 7 |
| ASTM D7566 Annex A5 | Alcohol to jet synthetic paraffinic kerosene | ATJ | Ethanol, isobutanol and isobutene from biomass | 50% | 8 |
ASTM asserts SAF produced from FT, HEFA, and AtJ must be blended with traditional petroleum based fuel, to a maximum of 50% SAF. By far, HEFA is the most commercially used method for producing sustainable aviation fuel. However, as will be revealed in this insight, all three technologies fulfil an economic and ecologic niche. Competitive price estimates and additional incentives present in the United States can lead to a further expansion of SAF production.
Emissions
As highlighted previously, SAF takes advantage of using carbon present in the carbon cycle to mitigate petroleum fuel emissions. SAF and traditional Jet-A fuel produce around 74 grams of CO2 equivalents per Megajoule of combusted fuel. For Jet-A, adding in emissions associated with extraction and refinement, this comes to approximately 83.5 grams of CO2e per MJ of fuel.
The chart below incorporates upstream emissions from feedstock harvesting and processing (linked to the biomass source), biogenic carbon assumptions, and emissions from the fuel conversion process itself — in addition to the standard 74 gCO2e/MJ from combustion. Transportation was purposefully left out of the study, as it usually accounts for only around 3 grams of CO2 equivalent per MJ and is highly dependent on feedstock, plant and destination locations.
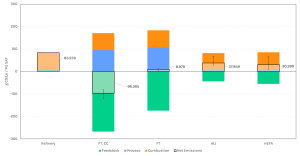
Figure 1: Emissions per MJ of fuel for a standard Refinery, Fischer-Tropsch (FT) with and without carbon capture (CC), Alcohol to Jet (AtJ), and Hydroprocessed Esters and Fatty acids (HEFA). Error bars represent minimum and maximum for reported values of that technology.
Ethanol AtJ and Soybean Oil HEFA have very similar emissions profiles. It has been shown that other bio-oil feedstocks, such as Corn Oil, have lower emissions due to more negative Indirect Land Use Change (ILUC) considerations (closer to 19 grams of CO2,e per MJ of fuel). FT, which is using forest residue for a feedstock, can bring even lower emissions. Biomass gasification into Fischer-Tropsch typically has a low carbon conversion. This produces more CO2 during the process itself, but in many cases this CO2 can be captured using Selelxol or similar technology. When CCS is implemented, FT SAF can claim significant negative carbon intensity. The results reported agree with other SAF emission calculations, such as CORSIA.
Selling Price
A major barrier to the implementation of sustainable aviation fuel is the costs associated with these technologies. For example, FT has a high capital cost compared to even most other SAF technologies. Shown below are the current minimum selling prices (Process NPV = $0) for each of the investigated SAF pathways:
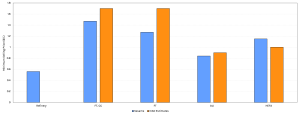
Figure 2: Minimum selling price for standard Jet-A, Fischer-Tropsch (FT) with and without carbon capture (CC), Alcohol to Jet (AtJ), and Hydroprocessed Esters and Fatty acids (HEFA). These values are shown in comparison to estimates given by the ICAO.
Cost of Avoided Carbon (CoAC)
To compare these technologies beyond just their selling price, we look at the Cost of Avoided Carbon (CoAC) — a critical metric for investors and policymakers assessing decarbonization ROI. This ratio allows for an apples-to-apples comparison of each technology with respect to the incumbent (Standard Jet-A).
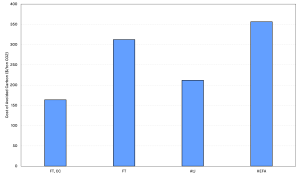
Figure 3: Costs of Avoided Carbon (CoAC) for Fischer-Tropsch (FT) with and without carbon capture (CC), Alcohol to Jet (AtJ), and Hydroprocessed Esters and Fatty acids (HEFA) with respect to traditional jet fuel.
CoACs for all technologies hover around 250 dollars USD per ton of CO2,e. The importance of adding carbon capture to FT is immediately present through CoAC. The CoAC of FT with carbon capture is nearly half that of FT without it.
SAF Policy in the US
While SAF is still more expensive to produce than traditional fuel, initiatives brought at both the federal and state level allow SAF to be economically competitive. A few examples include:
• The Clean Fuel Production credit came into effect in January 2025, replacing the Sustainable Aviation Fuel credit. The credit rate is 35 cents per gallon of SAF, but can be up to $1.75 per gallon through other incentives. The IRS releases emission factors according to each SAF production process, which is used to scale the credit rate.
• Washington state’s SB 5447 gives a $1.00 per gallon tax credit for SAF that emits at least 50% less CO2,e than traditional jet fuel. Additionally, the act incentivises up to $2.00 per gallon with a 2 cent increase for every additional one percent reduction in CO2,e emissions (beyond 50% reduction).
• Similarly, starting in 2027 Nebraska’s LB 1072 is providing a 75 cent per gallon credit for SAF that emits at least 50% less CO2,e than traditional jet fuel, and 1 cent per gallon extra for each additional percent above 50%.
• Minnesota’s SAF Credit (SF 1312) is $1.50 per gallon for 50% emissions reduction. This credit requires the fuel must be produced, sold and used only within Minnesota.
Conclusions and Future Insights
SAF presents a tangible and scalable solution to reducing aviation fuel emissions. With a decrease in capital costs and a rise in tax incentives, SAF has shown the potential to be both ecologically impactful and economically viable. But as we’ve seen just in differences in state policy, there is no one-size-fits-all for SAF. This is especially true when factoring in different types of biomass feedstocks and process conditions. In our next insight, we will take a deep dive into a SAF pathway and look at the impacts of decarbonizing process heat, electricity and even upstream processes play in reducing SAF carbon footprint and credit incentive.
Sesame Sustainability offers process-specific emissions and cost modeling. All results obtained above were gathered through Sesame’s software platform.