
Following our previous analysis on decarbonizing HEFA production, we now explore the optimization of green hydrogen production systems across different U.S. locations.
In our previous analysis, we explored decarbonization pathways for HEFA production, examining the cost and emissions trade-offs under state and federal incentives. We investigated decarbonizing process heat via grid electricity and carbon capture, the integration of solar electricity, and the comparison between blue and green hydrogen. We found that while decarbonizing process heat is most economical under current Washington incentives, green hydrogen offered significant emissions reductions.
Green hydrogen is produced via the electrolysis of water, which is an energy-intensive process that requires abundant low-carbon electricity. When renewable electricity is sourced, the production of hydrogen becomes variable – storage becomes required to ensure that hydrogen flows at a constant rate out the plant gate. Also, depending on the project location, an optimal mix of solar panels and wind turbines can be calculated to obtain the lowest levelized cost of hydrogen.
Here we use Sesame’s hydrogen system optimization model to investigate the production of electrolytic green hydrogen in more detail. We evaluate how location influences capacity deployment, costs, emissions, and cost-optimal operating strategy.
Scenarios: 100% grid, and 45V compliant
Three locations are evaluated: Texas, California, and Washington. These states are characterized by different electricity mixes, wind and solar resources, and grid prices. For each location, two scenarios are analyzed:
• 100% grid: benchmark of electrolytic emissions intensity and cost in a simplistic setting
• 45V compliant: electrolytic hydrogen with a carbon intensity <0.45kgCO2/kgH2, eligible for a $3/kgH2 tax credit. In this scenario, dedicated wind and solar farms are deployed to power the electrolyzer.
Both cases evaluate the required asset deployment to fulfil an annual hydrogen demand of ~14,000 tons/year, which could support a HEFA plant with a capacity of 1.5M barrels of jet fuel per year.
The 45V scenario is particularly nuanced, since hourly matching will be required as soon as 2028 to obtain the full tax credit. To minimize the Levelized Cost of Hydrogen (LCOH), the deployment and wind and solar capacity must be optimized for a given project location. This ensures that the renewable assets, the electrolyzer, and additionally, hydrogen storage, are used optimally.
100% grid scenario
In the all-grid scenario, the LCOH varies between $5-12/kgH2, while the emissions tally 7.3-21 kgCO2eq/kgH2. The total electrolyzer capacity is 96 MW, operating at nearly full capacity. Significant regional variations exist. Texas, benefiting from a grid price equal to ¢6.8/kWh, provides an LCOH slightly above $5/kgH2, where electricity constitutes almost $4/kgH2. Washington’s LCOH is similar due to comparable electricity prices. Conversely, California’s electricity price is very penalizing to the LCOH.
Regarding emissions, Texas’ electrolytic hydrogen would carry a carbon intensity almost double that of a conventional Steam Methane Reformer (SMR). Given their relatively cleaner grids, California and Washington’ hydrogen emissions are around or below that of an SMR, but still fall short of being 45V compliant.
This highlights that powering an electrolyzer from the grid can lead to an increase in emissions compared to the incumbent, fossil-fueled process, while also increasing costs.
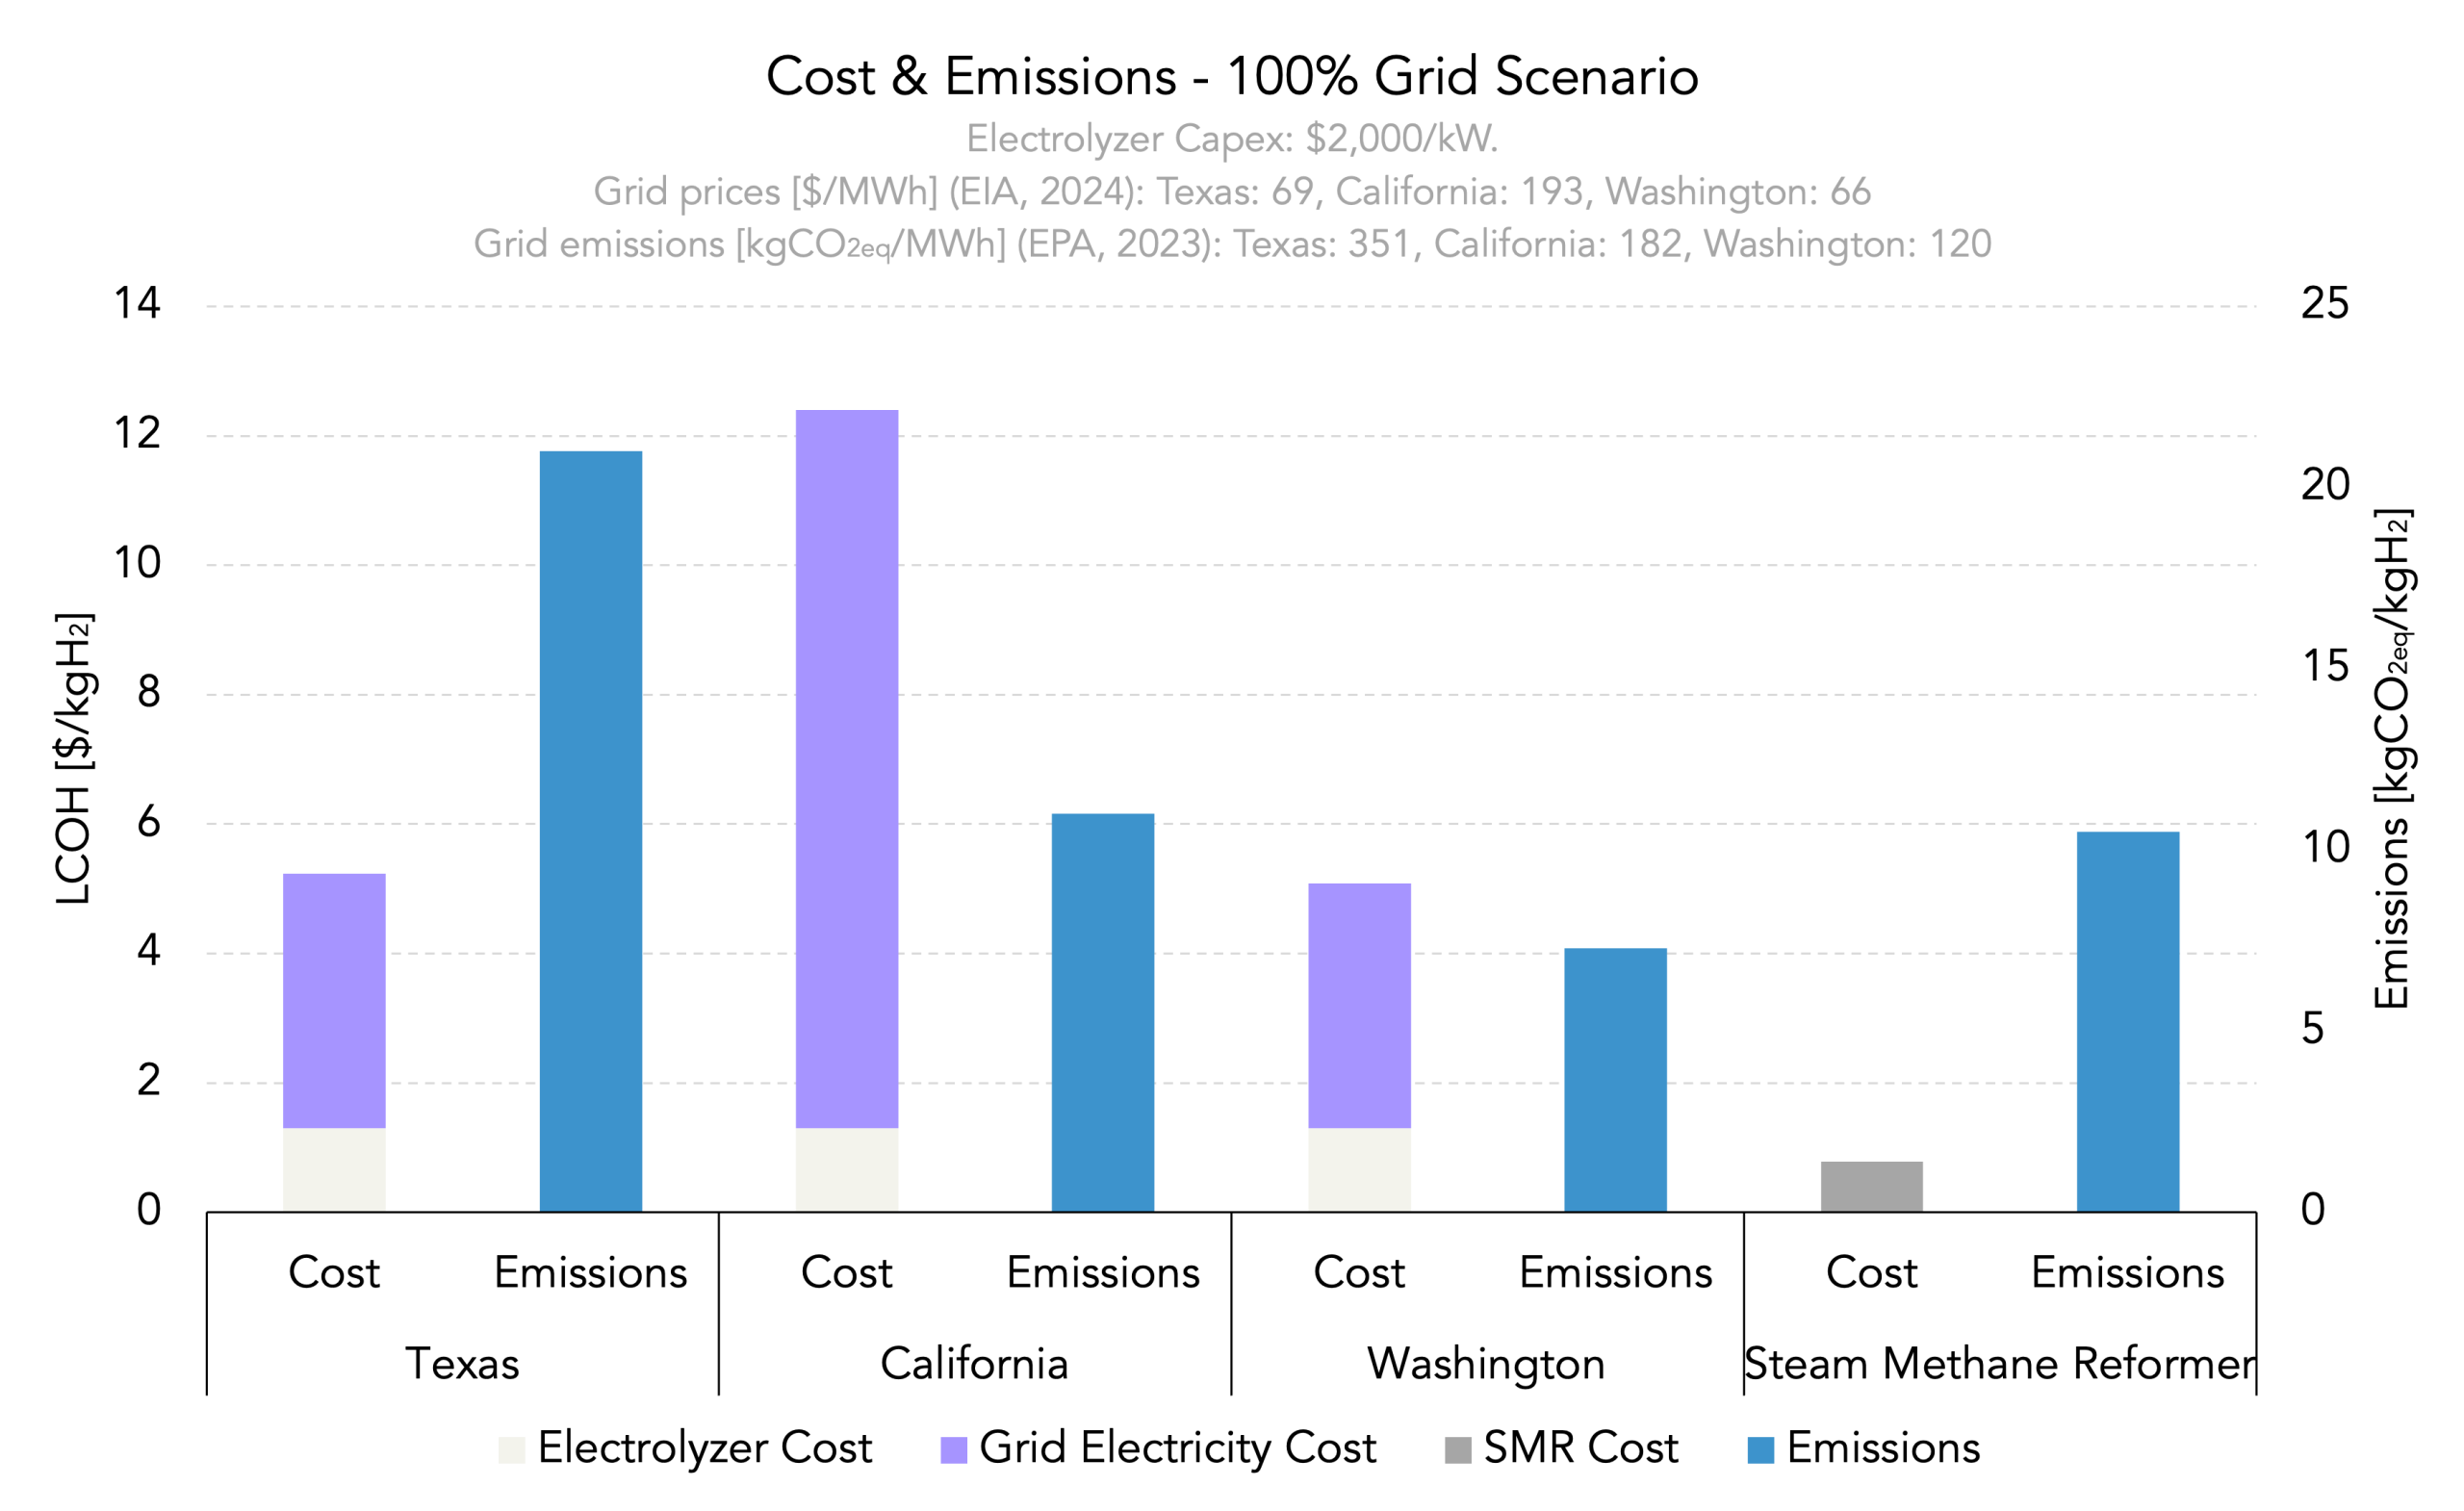
Figure 1: Comparison of emissions and costs for the 100% grid scenario across Texas, California, and Washington.
45V Compliant Scenario
The carbon intensity of electrolytic hydrogen production can be reduced by deploying low-carbon electricity production technologies such as wind turbines or solar panels. To incentivize such a scenario, the US government released the 45V tax credit, which provides a $3/kgH2 tax incentive if the emissions intensity of hydrogen remains below 0.45kgCO2eq/kgH2. To remain compliant, the electrolyzer must be powered by renewables, and the electricity consumed must be matched by the electricity produced at every hour (starting in 2028). As the electrolyzer follows the production curve of the renewables, hydrogen production becomes variable. To ensure that the output at the plant gate is constant (a typical industrial requirement), hydrogen storage is required.
Renewable resources drastically vary depending on the project location. To best capture the available resources and minimize asset deployment, project developers should leverage optimization models that capture hourly production variability, providing realistic outcomes.
Using Sesame, 45V compliant scenarios were modeled for all regions. The cost-optimal capacity deployments for each region and corresponding LCOH values were calculated.

Figure 2: Optimal asset deployment across Texas, California, and Washington.
The corresponding, cost-optimal LCOH are as follows:

Figure 3: Levelized Cost of Hydrogen in Texas, California, and Washington.
The LCOH ranges between $2.6-4.3/kgH2 post 45V credits. The optimal asset deployment in all locations requires a blend of wind and solar. Surprisingly, even California deploys wind in greater quantities than solar, despite relatively poor resources. Overall, the electrolyzer capacities range between 113-119 MW, and operate at 81-85% capacity factor.
Such high capacity factors are attained due to the oversize of renewable capacity compared to the electrolyzer capacity, as well as the synergistic dynamic between solar and wind production. For each GW of electrolyzer installed, between 2.4 and 3.3 GW of renewable capacity is built out. Also, wind is found to be beneficial in all locations due to its relatively more flat production profile compared to solar, which therefore decreases storage requirements to fulfil a constant hydrogen demand.
Oversizing renewable capacity can lead to curtailment during times of high production. Overall, curtailment reaches 14-18% depending on the location. While curtailment is usually perceived as a loss of revenue, the oversize enables the system to require less hydrogen storage, which is very costly. As such, the optimization truly uncovers the optimal deployment between renewable capacity, electrolyzer capacity, and storage capacity, instead of considering them in silos.
Hydrogen storage ranges between 56-73 tons H2, and stores 8-10% of hydrogen produced to be dispatched during times of low production. This enables the system to dispatch hydrogen at a constant rate, a typical requirement in industrial operations.
To remain below the required emissions threshold, the electrolyzer can only consume electricity from the grid in restricted amounts. This amount considerably varies depending on the grid: only 2% of the total electricity consumed was from the grid for Texas, and up to 8% in California. Grid electricity is found to be most consumed during low renewable production months.
| Texas | California | Washington | |
|---|---|---|---|
| Electrolyzer Capacity [MW] | 118 | 113 | 119 |
| Renewables Capacity [MW] | 284 | 374 | 368 |
| Storage Capacity [tons H2] | 68 | 56 | 73.7 |
| Oversize [GWren/GWelyz] | 2.4 | 3.3 | 3.1 |
| Electrolyzer Capacity Factor [%] | 82 | 85 | 81 |
| Grid Percentage [%] | 2 | 8 | 6 |
| Renewables Curtailment [%] | 18 | 15 | 14 |
| Percentage Hydrogen Stored [%] | 10 | 8 | 9 |
| LCOH (post-subsidy) [$/kg H2] | 2.6 | 4.3 | 3.7 |
Table 1: Comparison of key parameters for 45V compliant green hydrogen production across Texas, California, and Washington.
Key Takeaways
This analysis highlights several key aspects related to electrolytic hydrogen production:
• Grid electricity can only be consumed in negligible amounts to ensure that electrolytic hydrogen is truly low-carbon.
• Even regions with low wind resources are found to deploy wind due to their less variable production curve compared to solar, thus decreasing storage needs.
• The lowest LCOH is attained by oversizing renewables, which increases the electrolyzer capacity factor despite increasing curtailment.
• Storage, despite high costs, is essential to ensure hydrogen throughput at the plant gate is constant.
• The 45V tax credit is not yet sufficient to close the price-gap with the incumbent production method.
In the following hydrogen articles, we will delve deeper into specific aspects of hydrogen production. Topics will include the influence of hydrogen storage technologies, the relative merits of using both wind and solar to power the electrolyzer, and the cost and emission influence of low-carbon hydrogen for a variety of pathways such as SAFs. Stay tuned!
All results obtained above were generated via Sesame’s software platform. Discover how Sesame Sustainability can transform your emissions and cost modeling processes! Contact us today to learn how Sesame can be leveraged to fit your unique needs. To learn more, visit Sesame Sustainability.