
Data-driven energy modeling optimizes power reliability, controls costs, and integrates renewables for maximum resilience. Our analysis examines how regional differences shape optimal strategies, comparing solar, battery, and hybrid solutions to prevent costly business disruptions.
How much does a power outage cost your business? Whether you’re running a retail chain, manufacturing plant, or distribution center, even a short disruption can mean lost revenue, supply chain delays, and operational downtime.
Many businesses still rely on outdated backup power strategies, assuming that a generator or minimal solar capacity will be enough. But as electricity grids face growing instability and extreme weather events become more frequent, it’s no longer a question of if your business will experience an outage, but when—and how well-prepared you are when it happens.
The key to energy resilience isn’t just having backup power—it’s having the right strategy.
At Sesame Sustainability, we use data-driven energy systems modeling to help businesses optimize power reliability, control costs, and integrate renewables without insufficient or unnecessary investments. Our recent analysis of multiple industrial and commercial facilities across different regions provides valuable insights into what works, what doesn’t, and how businesses can future-proof their energy strategies.
Power outages create immediate business disruption—lost revenue, supply chain delays, and operational downtime. Our analysis of facilities across three U.S. regions reveals that:
• Regional differences significantly impact optimal energy resilience strategies
• Solar and battery storage solutions reduced energy costs by up to 20% annually in California
• Companies without renewable integration faced 40% increases in grid-related expenses during peak outages
• One-size-fits-all approaches to energy resilience result in either insufficient protection or wasted investment
As extreme weather events become more frequent and electricity grids face increasing strain, traditional backup power approaches are proving inadequate. The key to energy resilience isn’t just having backup power—it’s having the right strategy based on your facility’s specific profile, regional grid conditions, and operational requirements.
Before examining specific regional strategies, it’s important to understand how energy demand patterns influence resilience planning:
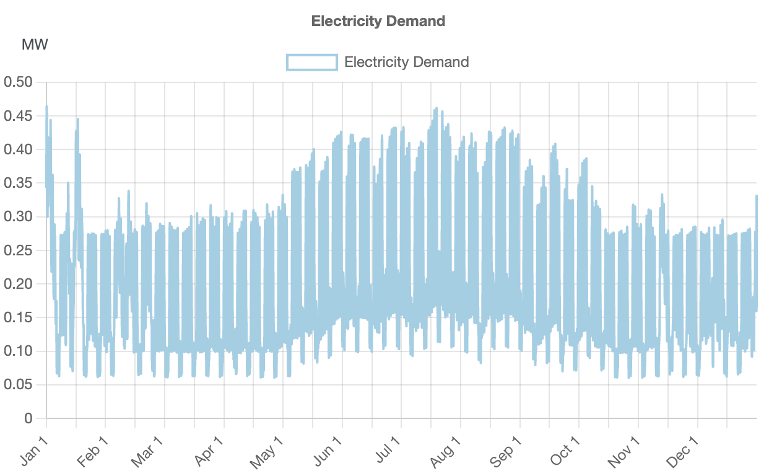
Figure 1: Representative Warehouse Load Profile (Annual). This year-long electricity demand profile shows how a warehouse’s energy needs fluctuate throughout the year, with significant daily and seasonal variations.
Resilience strategies must account for these patterns when sizing battery storage and backup generation capacity. Note the higher peaks during summer months (June-September), which coincide with periods of higher grid strain in many regions.
Our analysis compares facilities in three distinct U.S. regions, each with unique energy challenges and resilience requirements:
1. West Coast Facility (California — CAISO Grid)
Current Status & Challenges:
• Connected to lower-carbon grid (198 kgCO₂/MWh) with existing solar PV
• Limited rooftop space restricts further solar expansion
• Vulnerable to seasonal grid disruptions, especially during peak demand
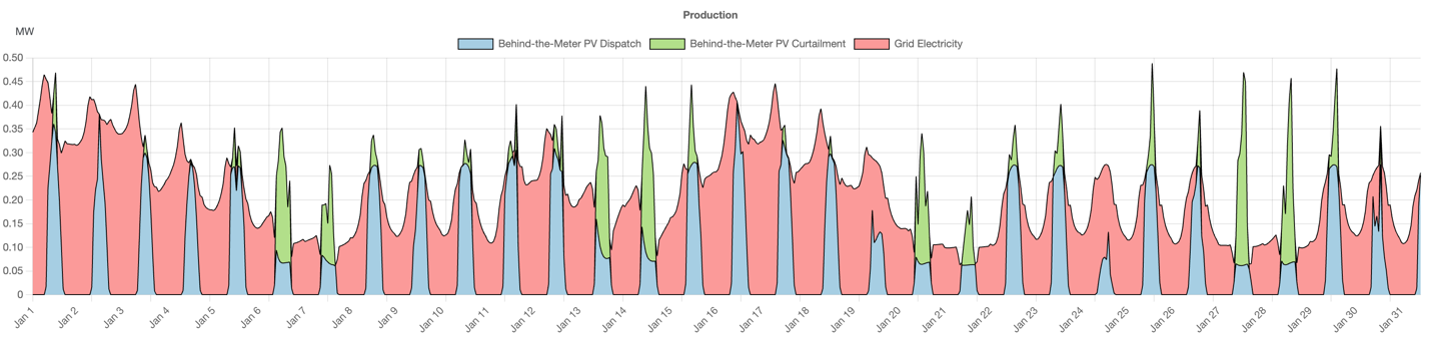
Figure 2: West Coast Facility Base Case Production Profile (January). This graph shows how the California facility relies on existing solar PV (blue) and grid power (red) with some cogeneration (green). While solar offsets some grid dependence, the facility remains vulnerable to outages.
Optimal Resilience Strategy: When facing a 48-hour grid outage during peak demand, our modeling shows that increasing battery storage significantly extends backup duration while reducing generator reliance. The optimal approach includes modifying solar dispatch to store excess generation for nighttime use and implementing load management to prioritize critical operations.
Recommendations:
• Increase battery storage to improve resilience against outages
• Implement demand-side management to reduce peak grid reliance
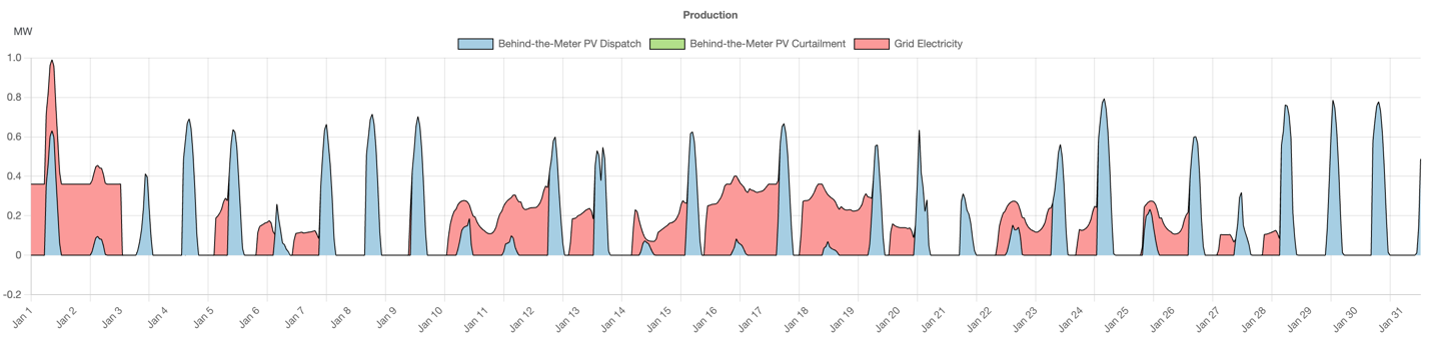
Figure 3: West Coast Facility During Short Outage (48 hours, January). This production profile demonstrates how battery storage (not visible in base case) enables the facility to maintain operations during grid outages by storing solar energy for use when needed.
Technical Insight: Even with existing solar, without dynamic energy storage dispatch algorithms, facilities will face operational disruptions during outages. Battery storage must be sized based on critical load requirements rather than total facility demand.
2. Southern Facility (Texas — ERCOT Grid)
Current Status & Challenges:
• High energy demand (9.4 MWh/day) with no existing solar PV
• Full reliance on higher-carbon grid (335 kgCO₂/MWh)
• Highly vulnerable to weather-driven outages despite significant rooftop potential
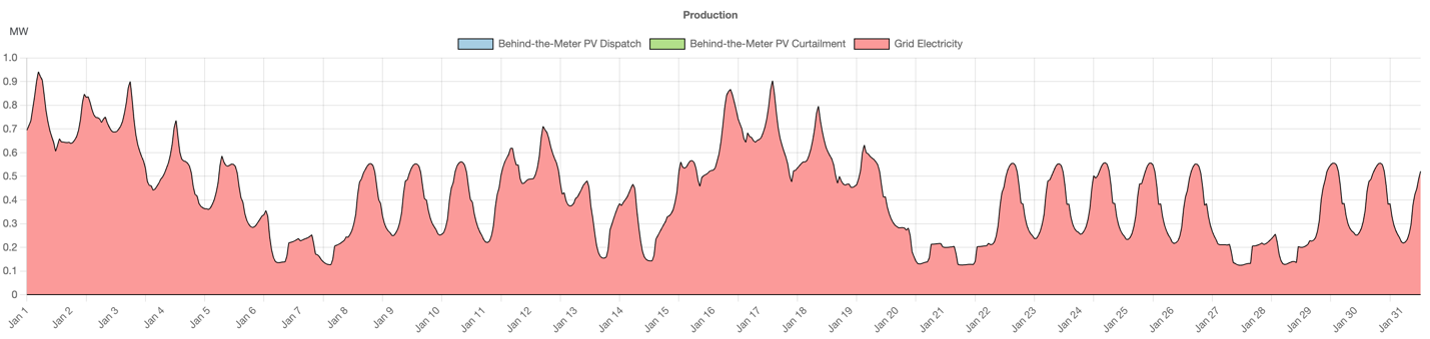
Figure 4: Southern Facility Base Case Production Profile (January). The Texas facility operates entirely on grid power (red) with no solar or storage, making it highly vulnerable to weather-related outages and price fluctuations.
Optimal Resilience Strategy: For extended 7-day outages common during extreme weather events in Texas, a hybrid microgrid approach combining solar, storage, and backup generation provides the most cost-effective solution. Our modeling shows pre-charging battery reserves before anticipated weather events significantly improves resilience.
Recommendations:
• Prioritize solar deployment to reduce grid dependence
• Pair solar with battery storage for enhanced reliability
• Evaluate hybrid microgrid options (solar + storage + backup generator)
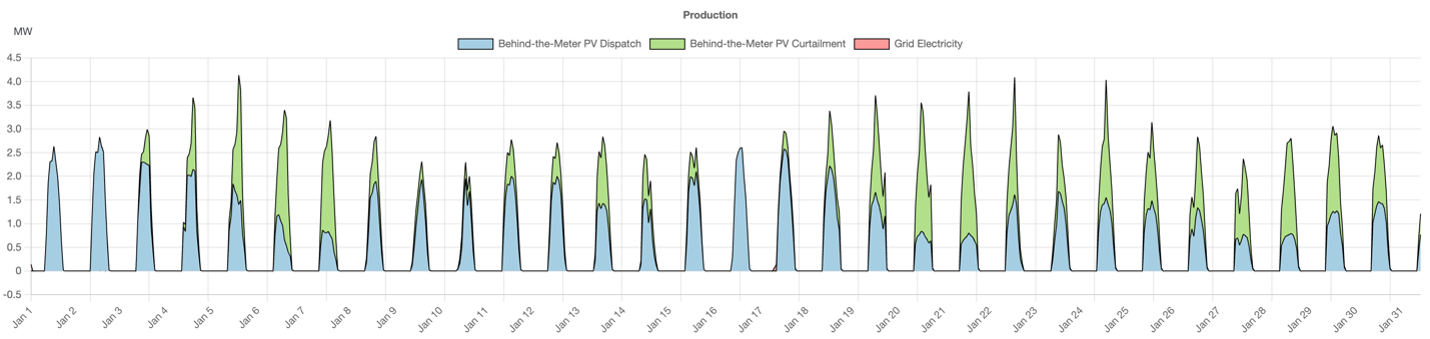
Figure 5: Southern Facility During Long Outage (7 days, January). With added solar (blue) and storage capacity, the facility can maintain critical operations during extended outages. Note the increased green areas representing optimized solar generation that wasn’t present in the base case.
Technical Insight: In long-duration outages, the dispatch sequence between solar, storage, and generators becomes critical. Without proper asset dispatch planning, facilities either deplete stored power too early or overuse fossil fuel backup, dramatically increasing both costs and emissions.
3. East Coast Facility (Mid-Atlantic — PJM Grid)
Current Status & Challenges:
• Moderate grid carbon intensity (270 kgCO₂/MWh) with no on-site generation
• Moderate rooftop space available for solar deployment
• More stable grid infrastructure but still susceptible to regional outages
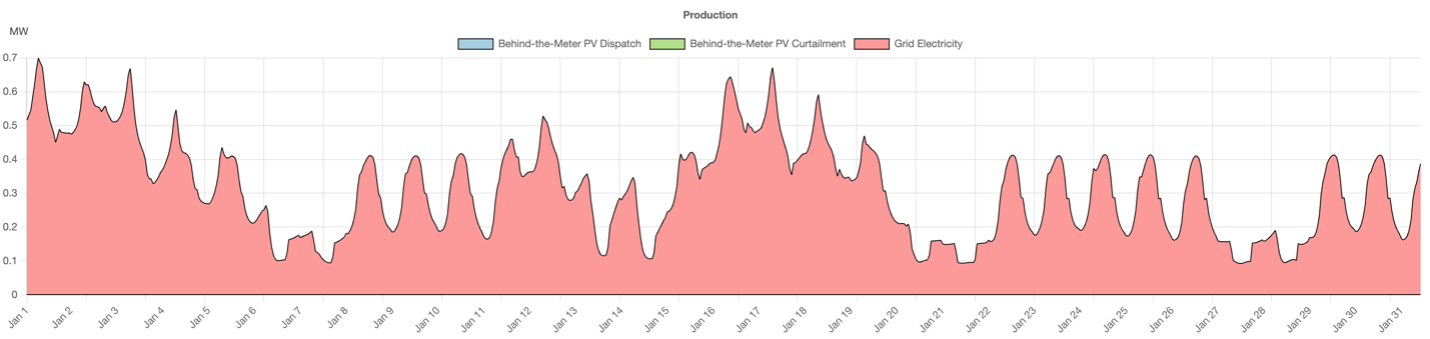
Figure 6: East Coast Facility Base Case Production Profile (January). The Mid-Atlantic facility depends entirely on fossil-fuel-based grid electricity. While grid reliability is better than Texas, full dependence on external power still poses risks.
Optimal Resilience Strategy: For this facility, dynamic load-shifting strategies that align operations with grid availability prove most effective during short-term grid instability. Battery storage provides cost protection during high-price periods while enabling participation in grid services.
Recommendations:
• Introduce on-site solar + storage to reduce emissions and improve resilience
• Explore Power Purchase Agreements (PPAs) and Virtual Power Plants (VPPs) to hedge against electricity price volatility
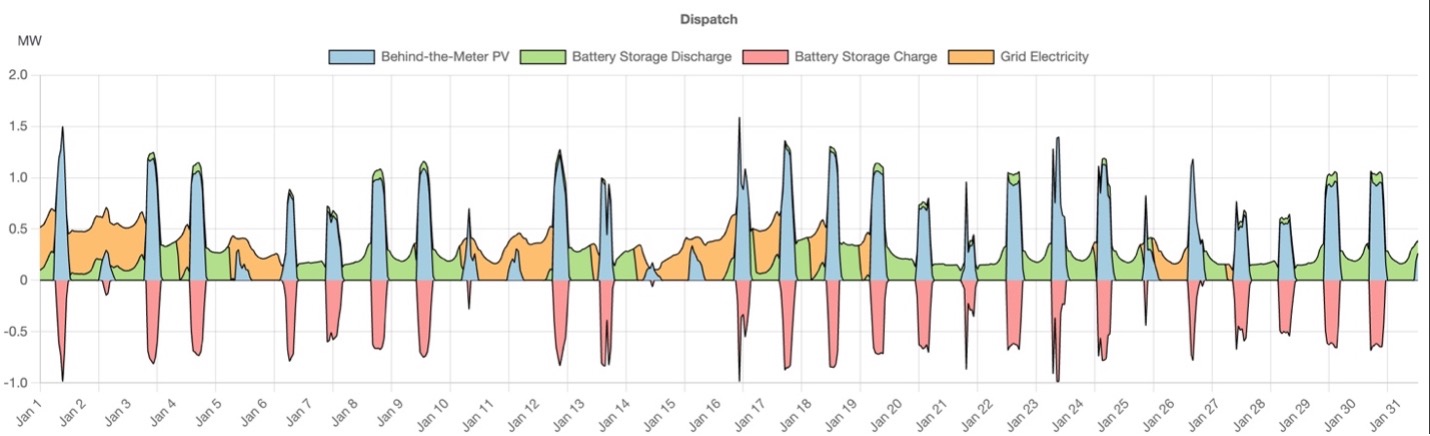
Figure 7: East Coast Facility Energy Dispatch During Summer Outage (July). This dispatch profile shows how battery discharge (green) and charge (red) can be optimized alongside solar generation (blue) and reduced grid usage (orange) during a summer outage scenario.
Technical Insight: Facilities in regions with more reliable grids can leverage demand response programs and Virtual Power Plant (VPP) capabilities to monetize their energy assets, providing financial benefits beyond just backup power.
We evaluated multiple outage scenarios to understand how different facilities would perform under various conditions:
| Scenario Type | Description | Key Technical Findings |
|---|---|---|
| Short Outages (48h) | Two 48-hour outages at different times | Battery storage with 4-6 hour capacity most cost-effective |
| Winter Resilience | Week-long outage in January | Highest LCOE due to limited solar generation; requires larger battery capacity |
| Summer Stress | Week-long outage in July | Solar contribution reduces battery requirements by up to 40% |
| Net-Zero Operations | Full renewable reliance | Highest initial investment but potential long-term cost stability |
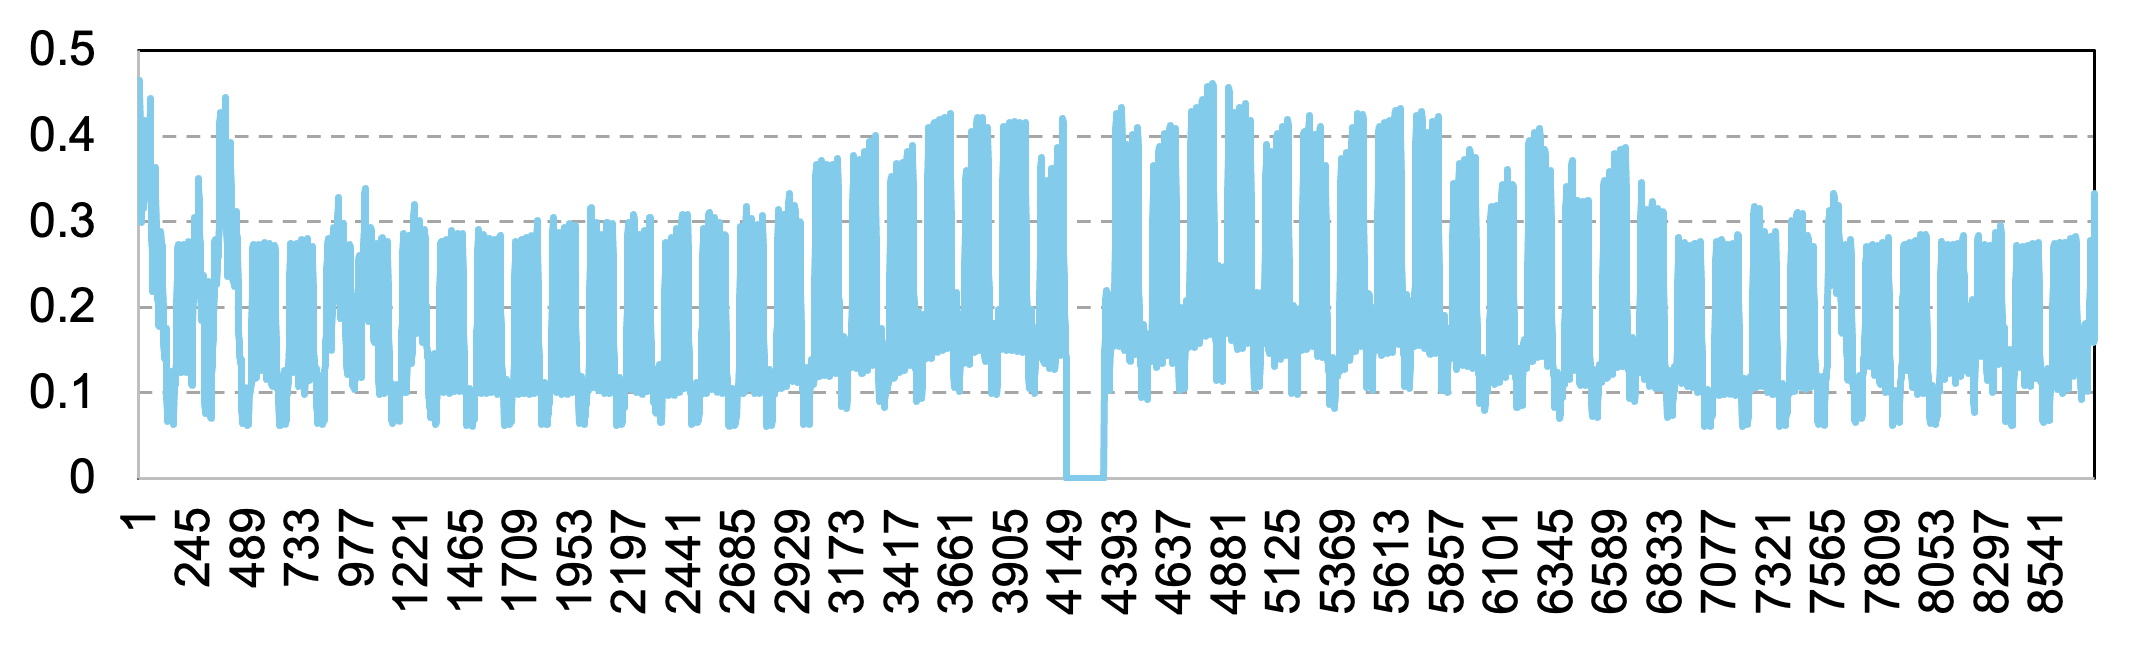
Figure 8: Grid Availability During Summer Outage Scenario. This chart shows grid availability during a one-week summer outage (Long 3 scenario), highlighting the periods where backup power systems must engage.
Results demonstrate that optimal energy infrastructure varies significantly by location. For instance, California offers the best return on investment (ROI) for clean energy, given its low grid carbon intensity and existing solar assets. However, Texas has the highest emissions impact, making decarbonization challenging without significant solar + storage investments. These differences are visualized in the following charts, which show installed capacity requirements and Levelized Cost of Energy (LCOE) across scenarios:
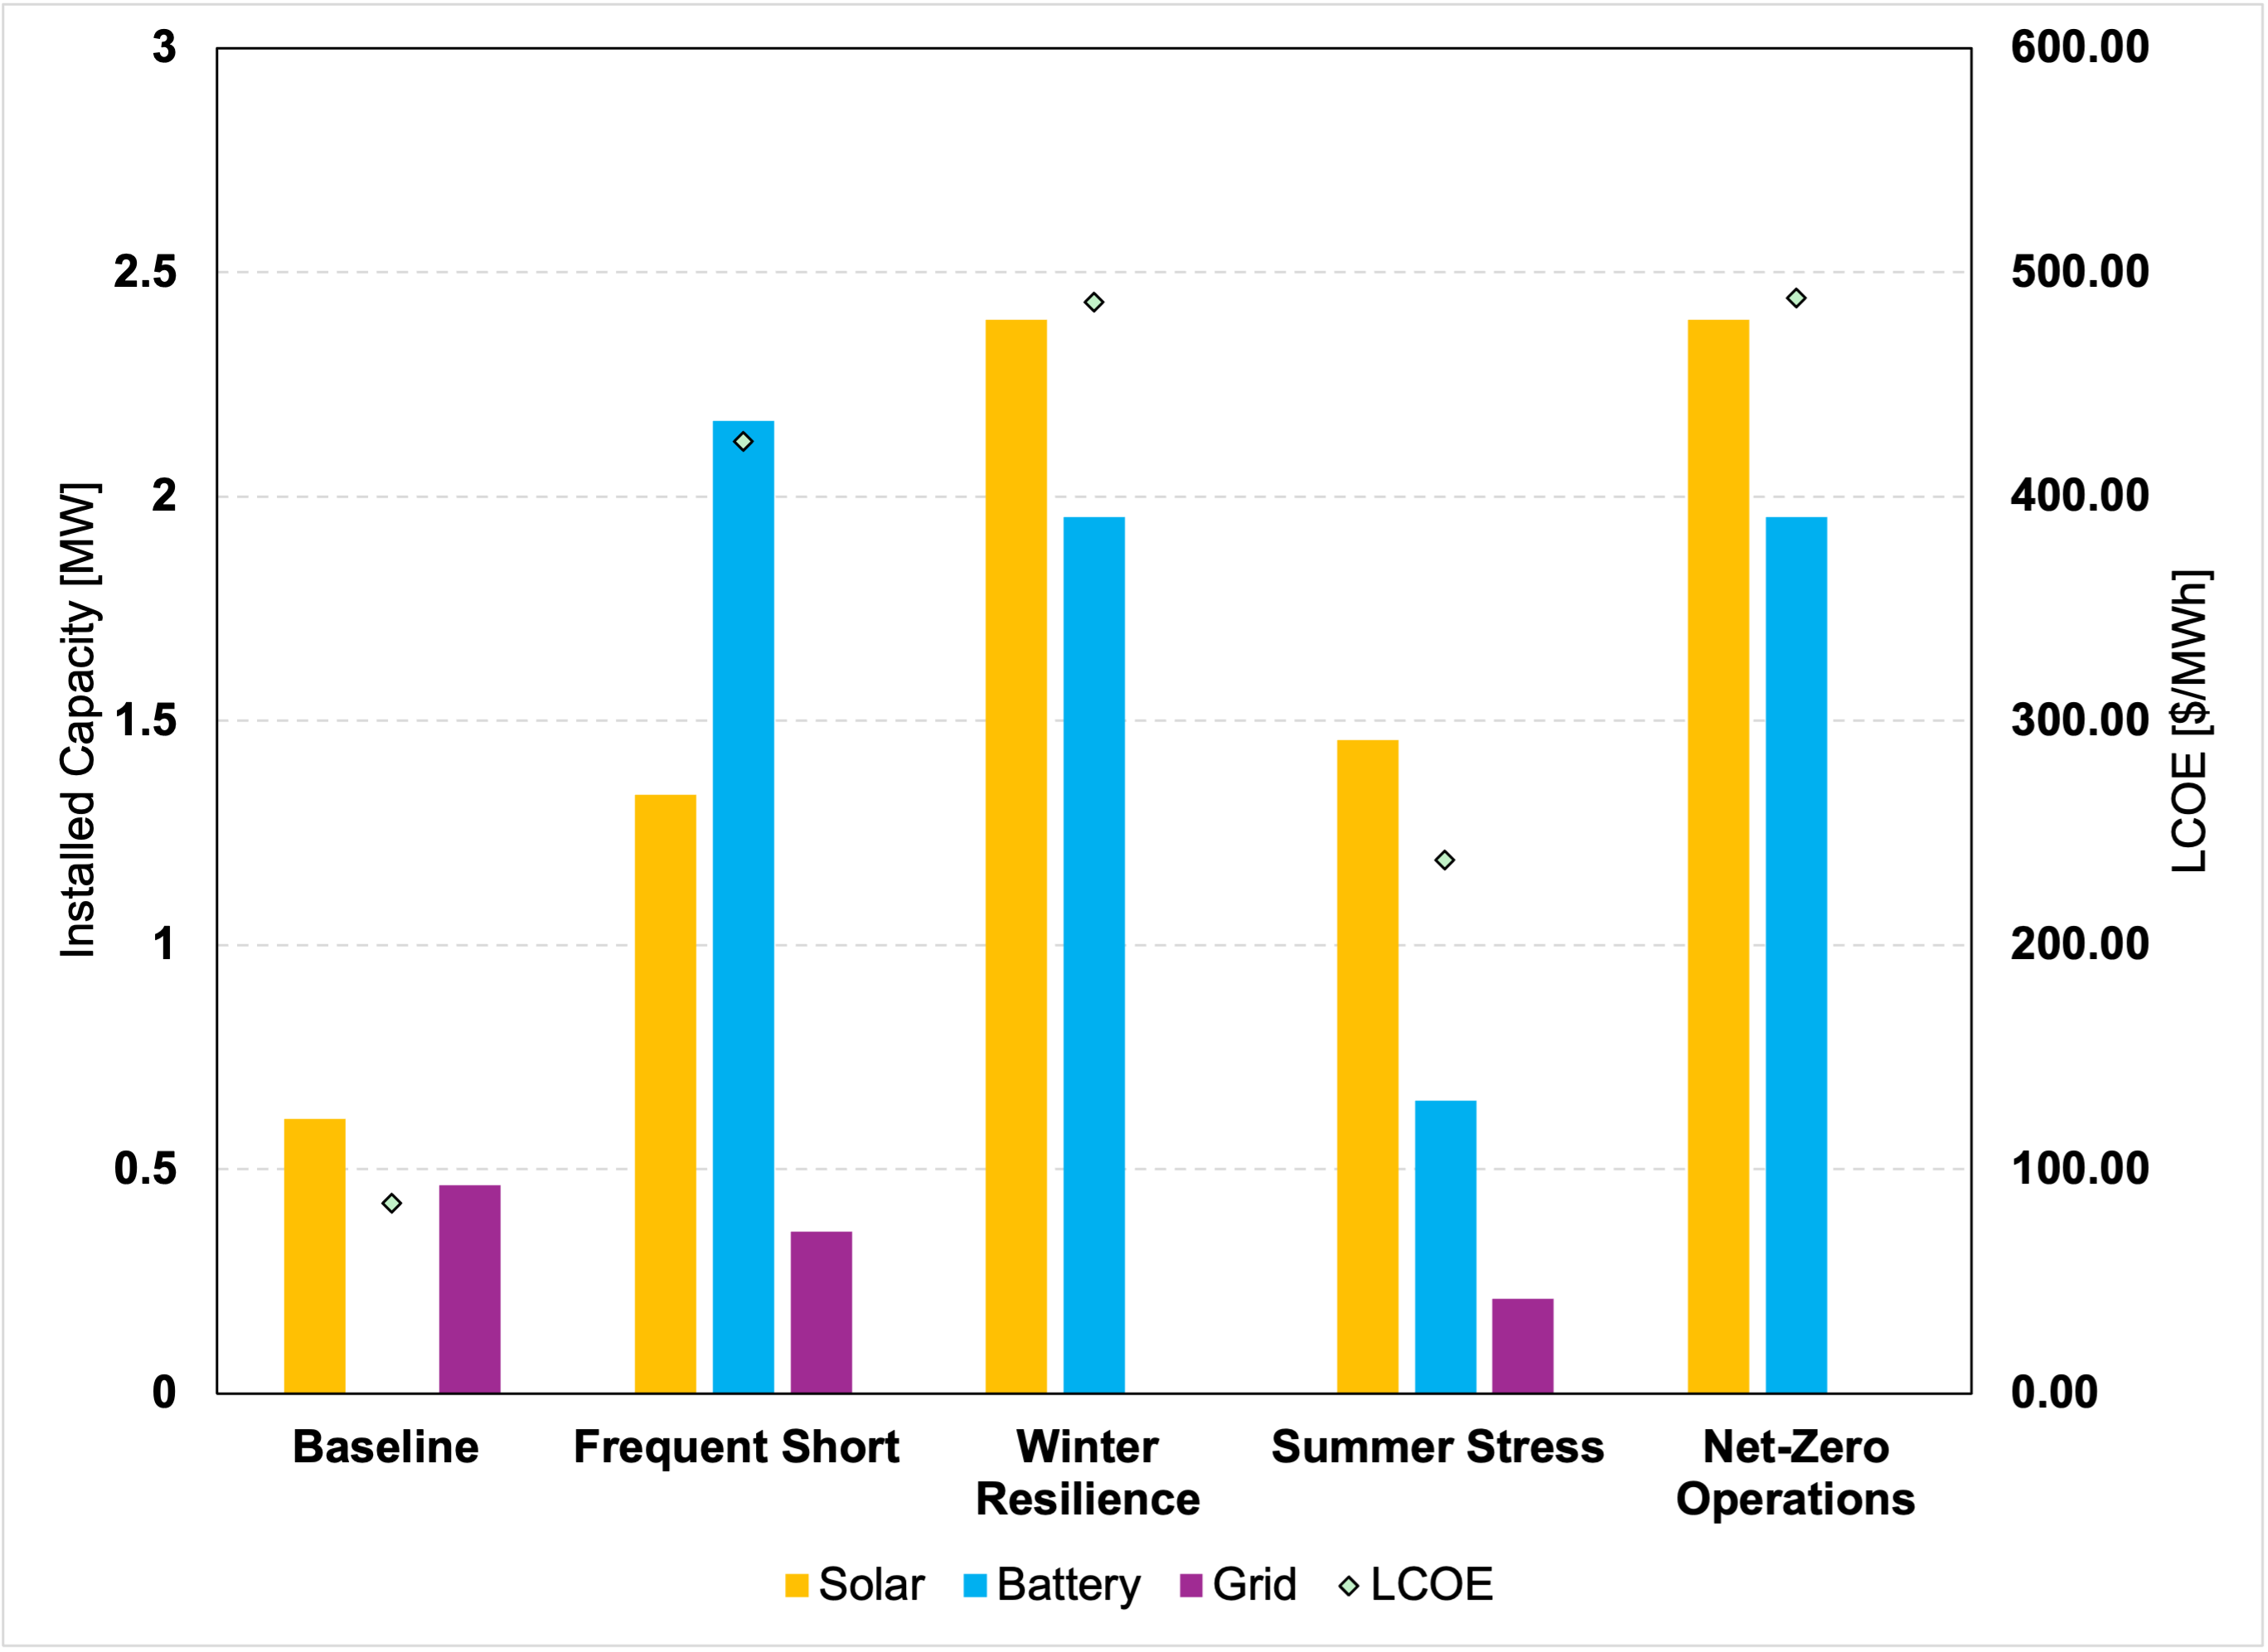
Figure 9: California Facility – Infrastructure Requirements and LCOE by Scenario. For the California facility, a balanced approach with moderate solar (yellow) and battery (blue, 4h duration) capacity provides the best economics. LCOE (diamond markers) remains relatively stable across scenarios due to existing solar assets and favorable conditions.
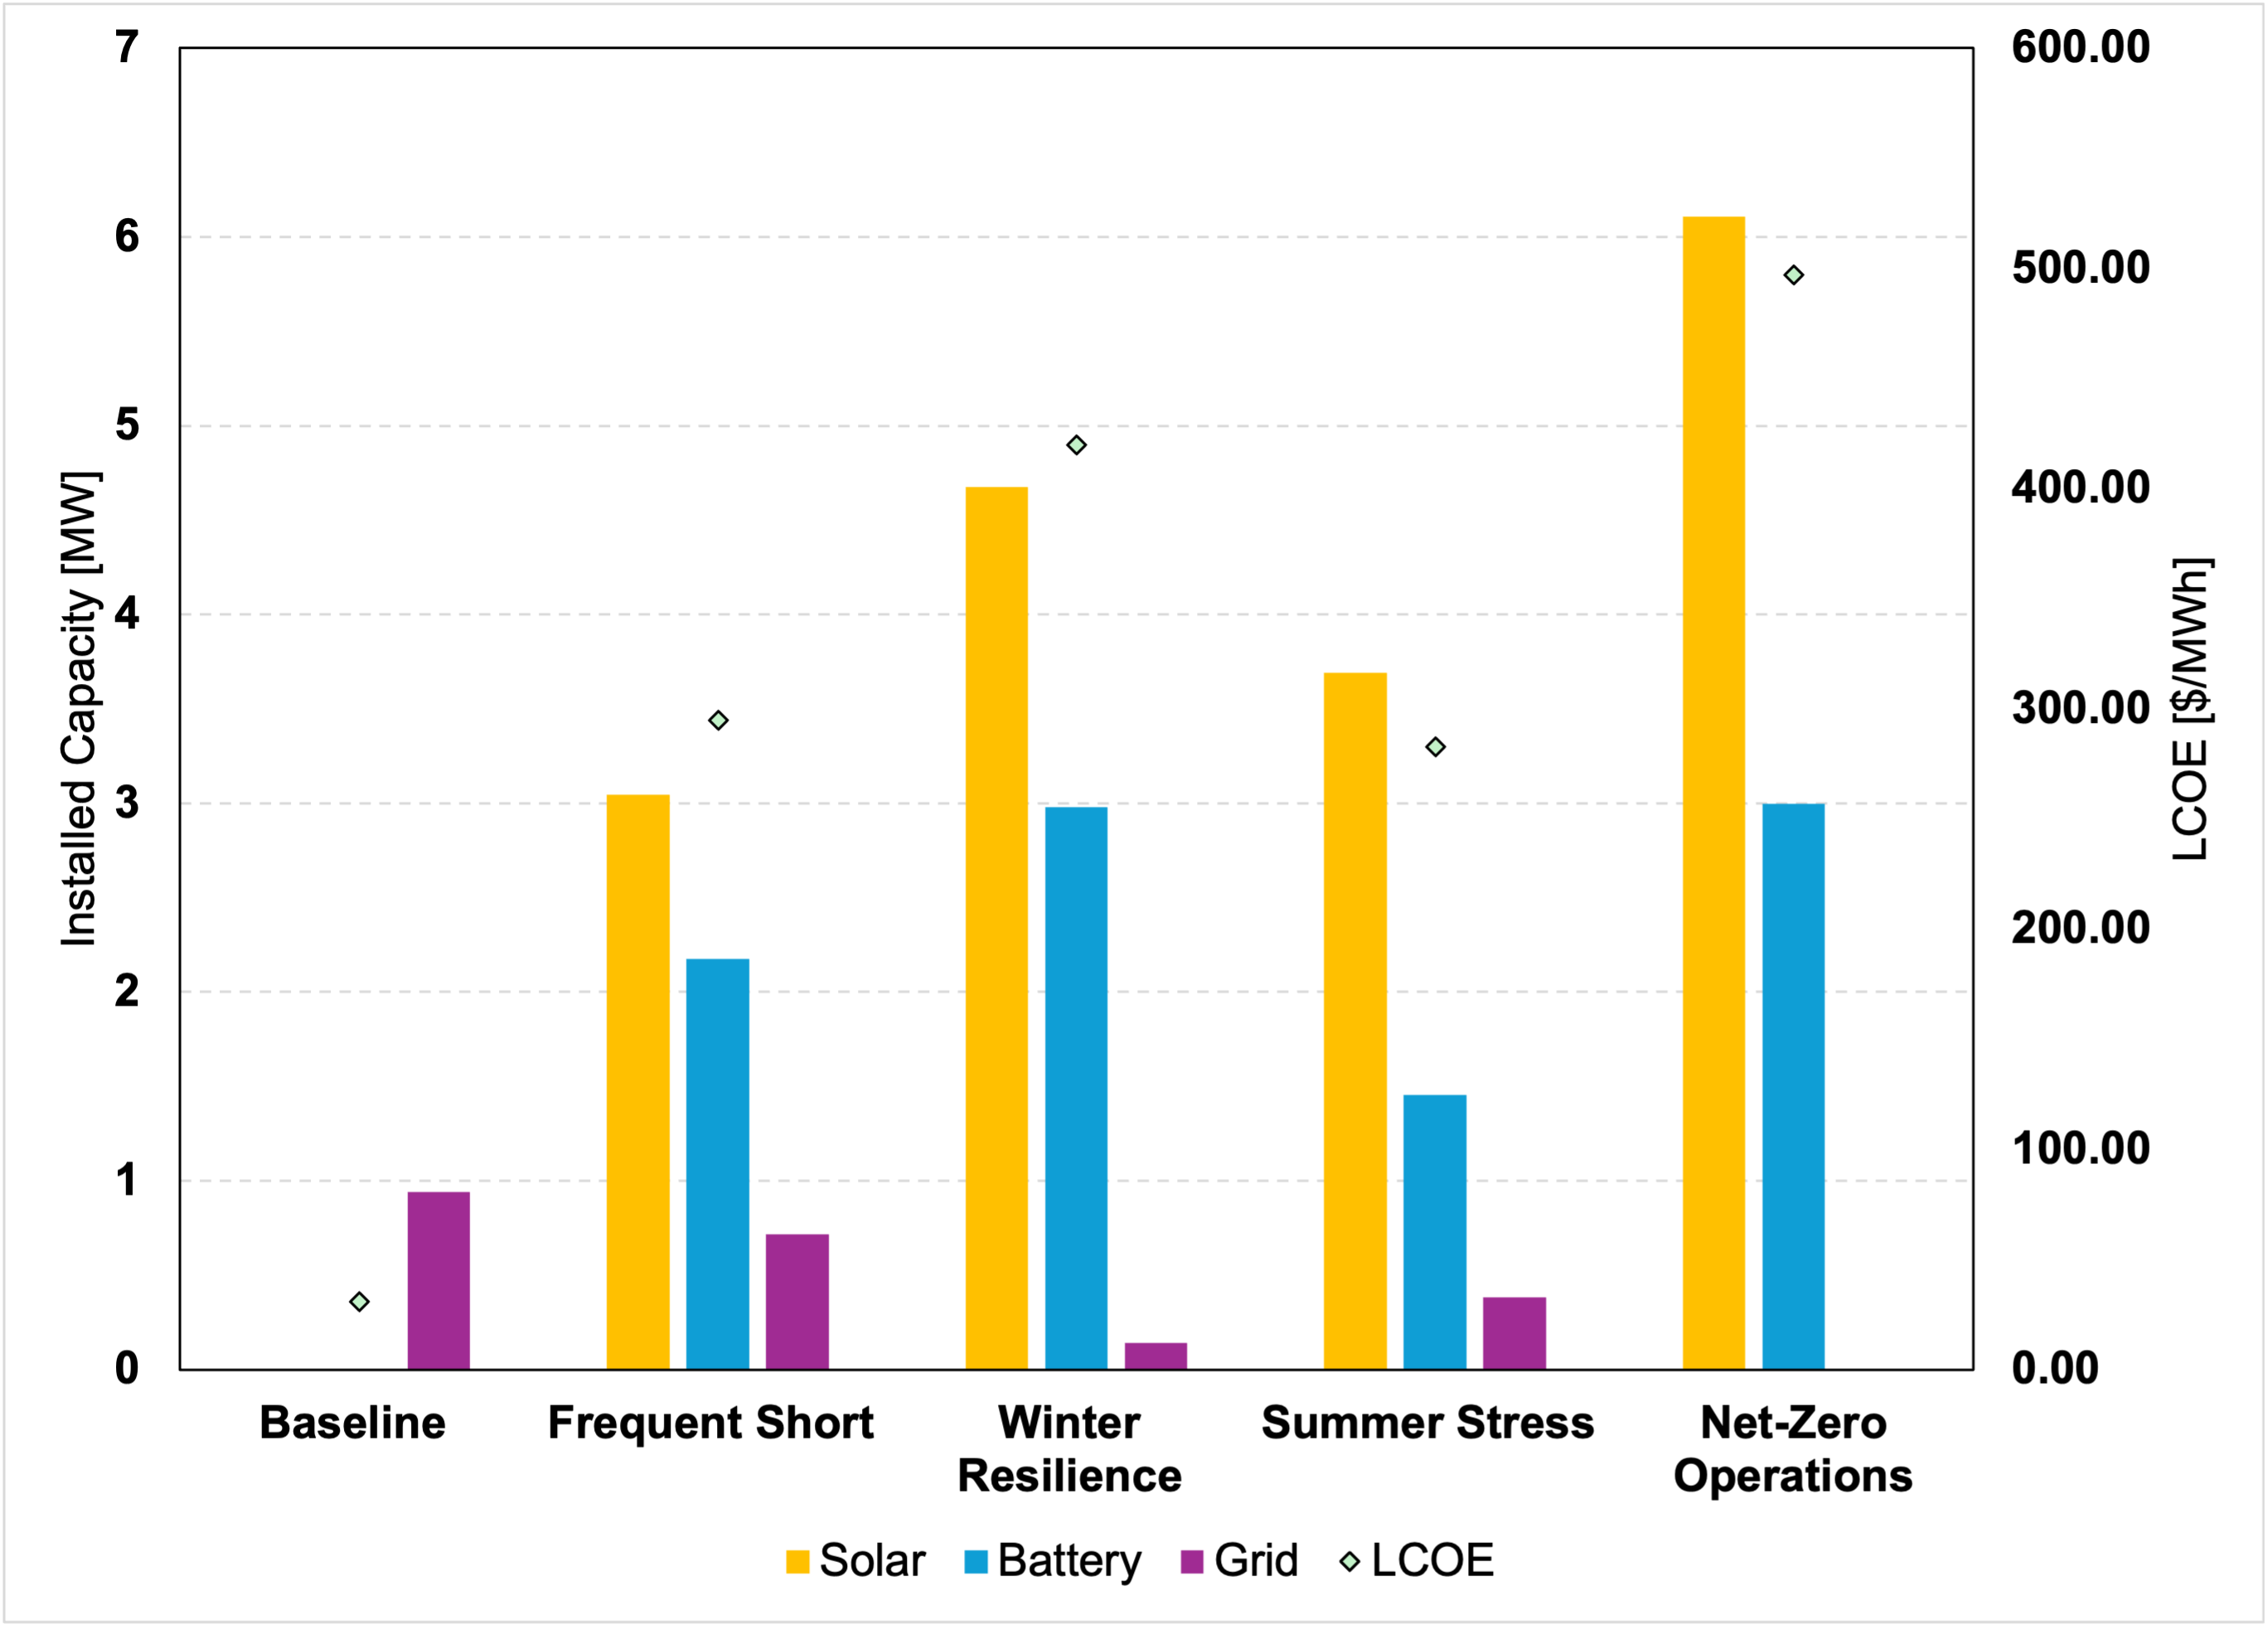
Figure 10: Texas Facility – Infrastructure Requirements and LCOE by Scenario. The Texas facility requires significantly larger solar capacity (yellow) and battery storage (blue, 4h duration) to achieve resilience. Note how LCOE (diamond markers) increases substantially during long outage scenarios due to the need for oversized infrastructure.
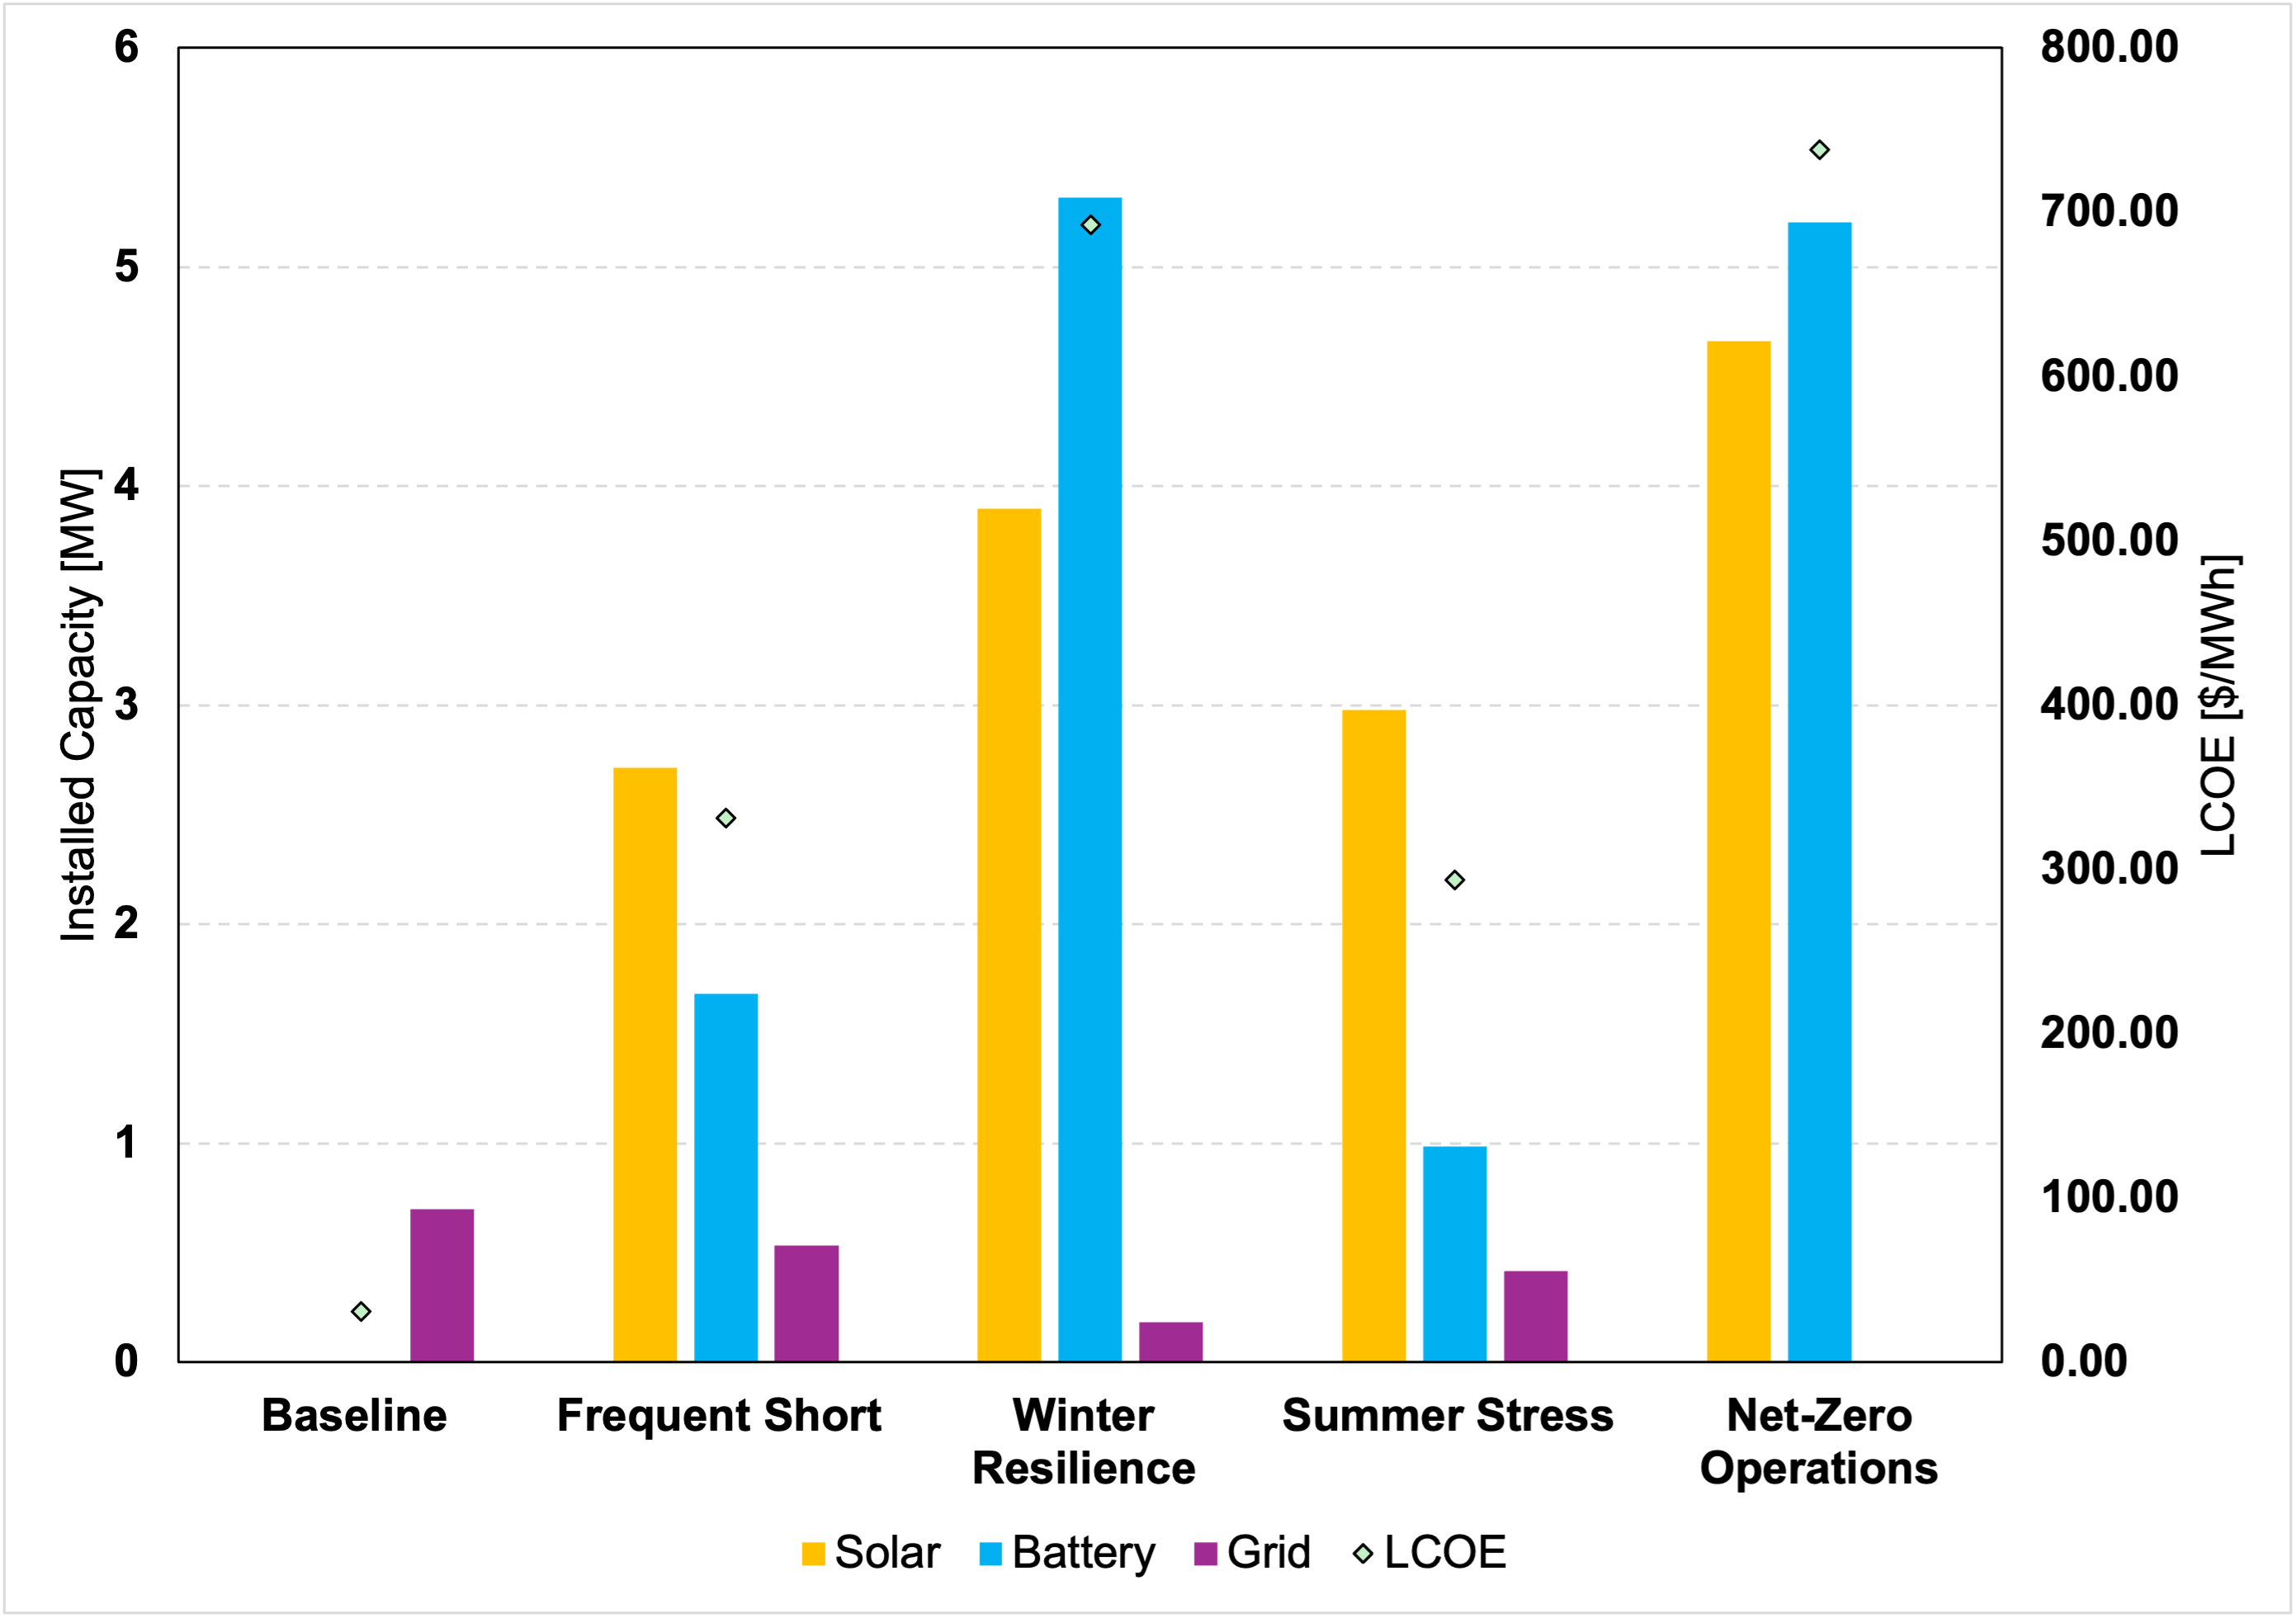
Figure 11: Pennsylvania Facility – Infrastructure Requirements and LCOE by Scenario. The Pennsylvania facility shows a more balanced profile with moderate infrastructure requirements. Grid reliance (purple) decreases across scenarios while maintaining reasonable LCOE values (diamond markers).
Key differences across regions include:
| Region | Optimal Solar Capacity | Battery Storage Requirements | Cost Considerations |
|---|---|---|---|
| California | Limited by available space | Medium (4-6h) | Most competitive LCOE with favorable solar conditions |
| Texas | High (large available roof space) | Larger (8-10h) for extreme weather | Significant LCOE increases during outages |
| Pennsylvania | Moderate | Lower (2-4h) due to grid reliability | Higher LCOE in net-zero scenarios |
Note on LCOE Calculations: The LCOE values presented assume that excess electricity generated is curtailed rather than sold back to the grid, which contributes to the relatively higher LCOE values seen across scenarios. Cost projections are based on NREL Annual Technology Baseline (ATB) values for 2024. All calculations use a 20-year financial lifetime for system components and apply a 9% depreciation factor with a 10% Weighted Average Cost of Capital (WACC). These conservative financial parameters, combined with the curtailment assumption, provide a realistic assessment of costs in purely resilience-focused deployments where grid interaction may be limited.
Static energy strategies fail to optimize the dispatch of existing assets, leading to either inadequate resilience or wasted investment.
Our hourly energy system modeling enables:
1. Optimized Asset Sizing: Right-sizing solar, battery storage, and backup generation based on actual facility needs
2. Dynamic Dispatch Planning: Determining the optimal sequence of energy source utilization during various outage types
3. Financial Optimization: Evaluating trade-offs between resilience investments and potential downtime costs
We find that the optimal dispatch strategy varies significantly based on:
• Outage duration (short outages favor battery storage, while extended outages require hybrid solutions)
• Seasonal conditions (winter resilience strategies differ from summer by up to 70% in solar contribution)
• Regional grid characteristics (carbon intensity, reliability, and pricing structures)
Sophisticated energy modeling helps businesses:
1. Size infrastructure appropriately – Avoid overbuilding backup capacity while ensuring critical operations remain online
2. Optimize dispatch strategies – Determine when to use stored energy versus generators or grid power
3. Leverage financial incentives – Identify opportunities for demand response, VPP participation, and other grid services that can offset costs
For businesses in high-risk regions like Texas, the financial case for resilience is compelling: the cost of power outages far outweighs the investment in backup systems.
For businesses operating in diverse energy markets, a one-size-fits-all approach to energy resilience is ineffective. Understanding grid conditions, outage risks, and site-specific constraints is critical for optimizing energy reliability, cost savings, and sustainability.
At Sesame Sustainability, we provide data-driven solutions that help businesses:
• Mitigate energy risks through strategic infrastructure planning
• Optimize renewable integration with proper sizing and dispatch algorithms
• Enhance operational resilience using sophisticated modeling techniques
Every business will face power disruptions—it’s only a matter of time. The companies that implement data-driven energy strategies now will reduce costs, avoid downtime, and gain a competitive edge in an evolving energy landscape.
This article is based on real-world energy system modeling. To learn more, visit Sesame Sustainability.